Tension / Compression Cycles, R ratio and a Discussion of Wohler Curve for Rubber

Fatigue Life of Rubber with different strain constraints

In fatigue testing, R is the ratio of the minimum to the maximum occurring during one period of a cycle.  If the mean value is zero (ie the cycle is centered on zero), then the minimum is equal and opposite in sign to the maximum.  In this case, we say that R=-1.  The cycle can be defined by various parameters.  If we define R in terms of the stress or the strain, then R may take either positive or negative values.  We might hear, for example, that R=-1 uniaxial loading is a symmetric tension / compression cycle.

Be careful about definitions, however! The Endurica material models define R in terms of the tearing energy (ie T = – dU/dA, where T is the tearing energy, U is the elastic potential energy and A is the crack area).  The tearing energy is the driving force responsible for crack growth.  It is always greater than or equal to zero.  When R is defined in terms of tearing energy, its range is 0 ≤ R ≤ 1.

This leads to the following question that we often hear:  how can Endurica compute fatigue in compression if it does not admit a negative R ratio?

Let’s look at a series of signals, all having the same strain amplitude, and each with a different mean strain.  We will set the mean strain so that it is at most equal to the amplitude (corresponding to fully relaxing R=0 tension), and at least equal to the negative of the amplitude (corresponding to fully relaxing R=0 compression).  In the middle of the range, we have fully reversed tension/compression (what some call “R=-1” loading when defining R in terms of strain).  The principal engineering strains are plotted below for each case.  This gives a smooth progression from a cycle that is only compression to a mixed cycle with both tension and compression and finally to a cycle that is only tension.

Series of signals with same strain amplitude but different Tension/Compression levels

Even for these simple uniaxial cases, the critical plane for simple compression is not the same as the critical plane for simple tension.  In simple compression, due to crack closure, the critical plane is the plane that maximizes shearing.  These planes make a 45-degree angle with the axis of loading (x direction).  In simple tension, however, the critical plane is perpendicular to the load (x direction).  In the figure below, the change in the critical plane as the mean strain increases from compression to tension is evident.  On each sphere, the arrows indicate the perpendicular of a critical plane.

Mean strain increase as compression to tension is evident with change in the critical plane

The next figure shows the cracking energy density (units of mJ/mm3, and proportional to tearing energy) as a function of time on the critical plane for each case.  The symbols on each line indicate the times at which the identified crack plane is open or closed.  Now we can see clearly that fully reversed tension/compression (ie “R=-1” loading in terms of strain) is really R=0 when viewed in terms of tearing energy on the critical plane.

Graphs showing the cracking energy density as a function of time on the critical plane. Fully reversed tension/compression is really R=0 when viewed in terms of tearing energy.

The computed fatigue life is given in the last figure for each case using this material definition:

MAT=RUBBER
ELASTICITY_TYPE=ARRUDABOYCE
SHEAR_MODULUS=1 ! MPa
LIMIT_STRETCH=4
BULK_MODULUS=3000 ! MPa
FATIGUE_TYPE=THOMAS
FLAWSIZE=0.025 ! mm
FLAWCRIT=1 ! mm
TCRITICAL=10 ! kJ/m^2
RC=3.42E-2 ! mm/cyc
F0=2
X(R)=LINDLEY73

The computed fatigue life depending on different percentages of tension/compression

The moral of the story:

  1. Fully reversed tension/compression cycles (“R=-1” in stress or strain terms) are really fully relaxing cycles (R=0 in tearing energy terms) from the perspective of the crack precursor on the critical plane.
  2. The critical plane depends on whether you have tension or compression. Wohler curve analysis completely misses the fact that the failure plane is not always perpendicular to the loading direction!
  3. A simple sinusoidal history that crosses through zero results in separate tension and compression events, each of which has its own peak and valley, and each of which influences the critical plane selection. Wohler curve analysis based on max principal stress or strain amplitude completely misses these physics.
twitterlinkedinmail

My SAE WCX 2022 Top Takeaway


SAE WCX | Detroit, Michigan | April 5-7, 2022

There were several papers on fatigue life prediction for elastomers at SAE WCX 2022, but the highlight for us was this one from Automotive OEM Stellantis: “Fatigue Life Prediction and Correlation for Powertrain Torque Strut Mount Elastomeric Bushing Application” by Dr. Touhid Zarrin-Ghalami, Durability Technical Specialist at FCA US LLC Fiat Chrysler Automobiles logowith coauthors C Elango, Sathish Kumar Pandi, and Roshan N. Mahadule from FCA Engineering India Pvt, Ltd.  Check out the abstract or buy the paper here…

The study shows that very accurate fatigue life prediction results are possible for elastomeric components under block cycle loading using Critical Plane Analysis.  A key feature of the analysis is the characterization and modeling of rubber’s hyperelastic properties, fatigue crack growth properties, crack precursor size, and strain crystallization behavior.  Careful measurement of these analysis ingredients led to a nearly perfect correlation of the predicted life (520 blocks) with the tested life (523 blocks, average of 4 replicate tests), and of predicted failure mode with observed failure mode.

Endurica users like Stellantis are developing a solid track record of routine and successful fatigue life prediction.  We soon expect to see the day when CAE fatigue life prediction for rubber components is regarded as obligatory, given the risk and cost avoided with “right the first time” engineering.

Congratulations to the Stellantis team on this impressive success!

 Fatigue Life (block) demonstrating the accuracy of the CAE Virtual Simulation compared to a physical test

Citation: Elango, C., Pandi, S.K., Mahadule, R.N., and Zarrin-Ghalami, T., “Fatigue Life Prediction and Correlation of Engine Mount Elastomeric Bushing using A Crack Growth Approach,” SAE Technical Paper 2022-01-0760, 2022, doi:10.4271/2022-01-0760.

twitterlinkedinmail

Things that went right in 2020 at Endurica

Things that went right in 2020 at Endurica

2020 is burned in all our minds as a chaotic and tough year.  Just like the rest of the world, Endurica staff experienced times of isolation and loss due to the pandemic.  On a positive note, we invested heavily in making our tools and workflows better than ever so that we’re ready to come back strong in 2021.  Here is a list of our top new developments in 2020:

Endurica Software Enhancements

  • Endurica DT’s new Ageing Feature now enables you to simulate how ageing affects your rubber product. Your compound’s stiffness, strength, and fatigue properties can all evolve with time.
  • Our new Linux distribution takes our solutions beyond the Windows world.
  • We’ve added an encryption feature to safeguard your trade secrets.
  • Viewer Improvements make it easier than ever to visualize your fatigue simulation results.
  • EIE Enhancements give you blazing-fast compute speed for full road-load signals.
  • We’ve also planned an aggressive development agenda for 2021. Stay tuned for a new Endurica-based smartphone app for materials engineers, for a new feature that computes fatigue threshold safety margins, for a new block cycle schedule extraction algorithm, and more!

Training

  • The new Fatigue Ninja Friday webinar series provides step-by-step application training for key the workflows that you need to get durability right. All of the recorded episodes are now available in the online Endurica academy.
  • The new Winning on Durability webinar series provides high-level overviews of both technical and business topics so you can connect Endurica tools to your strategic imperatives. All of these recorded webinars are available gratis on our website.
  • We’ve recast our in-person training events as LIVE, ONLINE workshops accessible safely around the world.

Testing Instruments

Fatigue Property Mapping Testing Service

  • We added the Reliability Module to our Fatigue Property Mapping testing service. Use it to quantify crack precursor size statistics when you need to estimate probability of failure.
  • We also reorganized the Thermal Module and the Ageing Module into Basic and Advanced levels, to offer a lower price-point when a basic option will suffice.

Want to leverage any of these new capabilities in your next durability project?  Give us a call and let’s talk!

twitterlinkedinmail

Does hydrostatic loading cause fatigue damage in rubber?

Hydrostatic

A question was recently put to us regarding the effects of cyclic hydrostatic loading on rubber.  In hydrostatic loading, no shearing stresses are present, and the 3 principal stresses all have the same value p.  For this case, all 3 Mohr’s circles degenerate to a single point on the normal stress axis.

 Mohr’s circles degenerate to a single point for the case of compressive hydrostatic pressure.

Figure 1. Mohr’s circles degenerate to single point for the case of compressive hydrostatic pressure.

Under dynamic hydrostatic loading, the point may move along the normal stress axis in either of the tensile (p>0) or compressive directions (p<0).  When we have pure hydrostatic compression, cracks in all orientations are closed with a tearing energy of zero.  We expect infinite fatigue life in this case.  On the other hand, when we have hydrostatic tension, growth of a crack will release energy, and so the tearing energy is positive. We then expect crack growth to occur at a rate determined by the tearing energy.  Endurica estimates tearing energy T via the following rule:

T = 2 πWC a

in which a is the size of the crack, and Wc is the cracking energy density. For a slightly compressible material under hydrostatic loading, the cracking energy density calculation becomes

WC = ∫ pd ε 𝜀

and, remembering that for volumetric deformation, the linear strain is 1/3 of the volumetric dilatation, we finally obtain

WC = 1/3 ∫ pd ε v = 1/3 W

where W is the dilatational strain energy density.


So let’s compute an example using the following material definition:

 Computation using different materials

Let’s compute 8 different fully relaxing hydrostatic loading cases: 4 in hydrostatic compression, 4 in hydrostatic tension.  We’ll take these loaded extreme strain levels: -10%, -5%, -2%, -1%, 1%, 2%, 5%, 10%, which correspond to extreme dilatations of -27%, -14%, -6%, -3%, 3%, 6%, 16%, 33%.

As a first check, we plot the hydrostatic pressures computed for each case.  The slope of the line is 3000 MPa, which agrees with the assigned bulk modulus.

 Plot of the hydrostatic pressures computed for each case

Figure 2. Computed volume strain – hydrostatic pressure relationship.

Next, we compute the strain energy density and the cracking energy density for each case.  As expected, we verify that for p<0, crack closure results in CED=0, and for p>0, CED=SED/3.

Comparison of strain energy density and cracking energy density for hydrostatic compression and tension.

Figure 3. Comparison of strain energy density and cracking energy density for hydrostatic compression and tension.

Finally, we compute the fatigue life for each case.  In all cases, we see that the damage sphere is uniform over its entire surface, indicating that all possible crack orientations receive equal damage.  We also see that for cases involving hydrostatic compression, life is essentially infinite.  For cases involving hydrostatic tension, we verify that finite life is predicted, with shorter life at higher hydrostatic tension, as expected.

 Predicted life and damage sphere for compressive and tensile hydrostatic loading.

Figure 4.  Predicted life and damage sphere for compressive and tensile hydrostatic loading.

In summary, we have verified that the Endurica fatigue solver behaves as follows with respect to hydrostatic loading:

  • In hydrostatic compression, no damage accrues, and life is indefinite.
  • In hydrostatic tension, crack growth is predicted, with shorter fatigue life for higher values of tension. The cracking energy density is 1/3 of the strain energy density for hydrostatic tension.
  • For all hydrostatic cases, there is no single preferred critical plane. Rather, all planes show equal potential for crack development.
twitterlinkedinmail

Is It Validated?

Is it Validated?

“Is it validated?” – that’s often the first question we hear after introducing our durability simulation capabilities. And for good reason, given the weight that hangs on the hinge of product durability. Endurica takes verification and validation (V&V) very seriously. Let’s look at what that means.

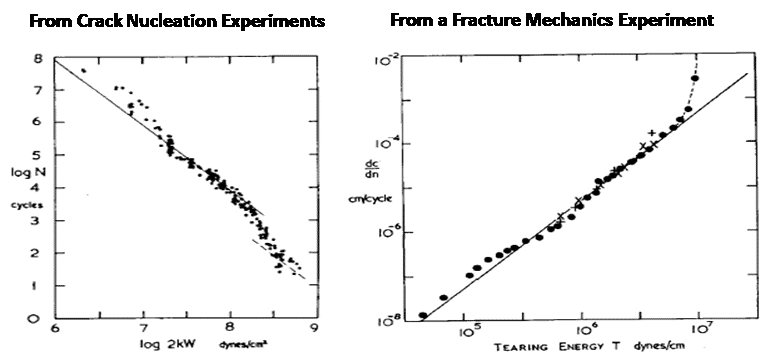
First, it means that our tools are built on well-known, well-established foundations.  These foundations include 1) definition of material / crack behavior via fracture mechanics (Rivlin and Thomas, 1953), 2) integration of the crack growth rate law to predict fatigue life (Gent, Lindley and Thomas, 1964), 3) the fact that crack precursors occur naturally in all locations and all orientations in a rubber sample (Choi and Roland 1996, Huneau et al 2016), 4) hyperelastic stress-strain laws compatible with commercial FEA codes (see Muhr 2005 for an excellent review), and 5) rubber’s fatigue threshold (Lake and Thomas 1967).  The validation case thus begins with the cumulative authority of thousands of reports that have confirmed these classical results over nearly 70 years.

Critical plane analysis for rubber has now been around for 20+ years, and it has been validated in multiple ways (material level, component level, system level), across multiple experimental programs (industrial and academic), by multiple independent research groups working on multiple applications (see Google/scholar, for example).  It has been validated that: 1) it correctly predicts crack plane orientation under uniaxial, proportional and nonproportional loadings (Harbour et al 2008), 2) it correctly predicts fatigue life across different modes of deformation (Mars 2002), 3) it correctly accounts for the effects of crack closure (Mars 2002), 4) it correctly predicts the development of off-axis cracks for nonrelaxing cycles in strain-crystallizing materials (Ramachandran 2017), 5) it correctly predicts the effects of finite straining on crack orientation (Mars and Fatemi 2006).

The literature is full of old experiments that we have used as validation targets.  We have validated Endurica’s strain crystallization models by simulating experimental results published by Cadwell et al (1940) and by Fielding et al (1943).  We have validated the ability to predict deformation mode effects by simulating experimental results for simple and biaxial tension published by Roberts and Benzies (1977).  We have validated Endurica’s temperature dependence against measurements reported by Lake and Lindley (1964).  We have validated against multiaxial fatigue experiments reported by Saintier, Cailletaud and Piques (2006).

We’ve done our own validation experiments.  My PhD dissertation (University of Toledo, 2001) contains an extensive database of tension/torsion/compression fatigue tests against which our critical plane algorithms were validated.  Two additional PhD dissertations that I co-advised generated additional validations.  Dr. Malik Ait Bachir’s thesis (2010) validated mathematically that the scaling law we use for small cracks is valid across all multiaxial loading states.  Dr. Ryan Harbour’s thesis (2006) contains a database of multiaxial, variable amplitude fatigue experiments against which our rainflow and damage accumulation procedures were extensively validated.

Validation from partners.  We partner with several testing labs.  We have invested in testing protocols that produce clean, accurate data and we have run validation programs with our partners to verify the effectiveness of our testing protocols.  We’ve demonstrated significant improvements to test efficiency and reproducibility (Goosens and Mars 2018) and (Mars and Isasi 2019).  We’ve validated techniques for estimating precursor size and size distribution (Robertson et al 2020, Li et al 2015).

Validation from users.  Three (3) of the top 12 tire companies and six (6) of the top 10 global non-tire rubber companies now use our solutions.  Most of our users have run internal validation programs to show the effectiveness of our solutions for their applications.  Most of these studies are unpublished, but the fact that our user base has continued growing at ~20%/year for 12 years (as of this year) says something important both about the technical validation case and the business validation case.  Validation studies have been published with the US Army (Mars, Castanier, Ostberg 2017), GM (Barbash and Mars 2016), Tenneco (Goossens et al 2017) and Caterpillar (Ramachandran et al 2017).

Validation from external groups.  There are several academic groups that have independently applied and validated components of our approach.  There are too many to list completely, but a few recent examples include Zarrin-Ghalami et al (2020), Belkhira et al (2020) and Tobajas et al (2020).

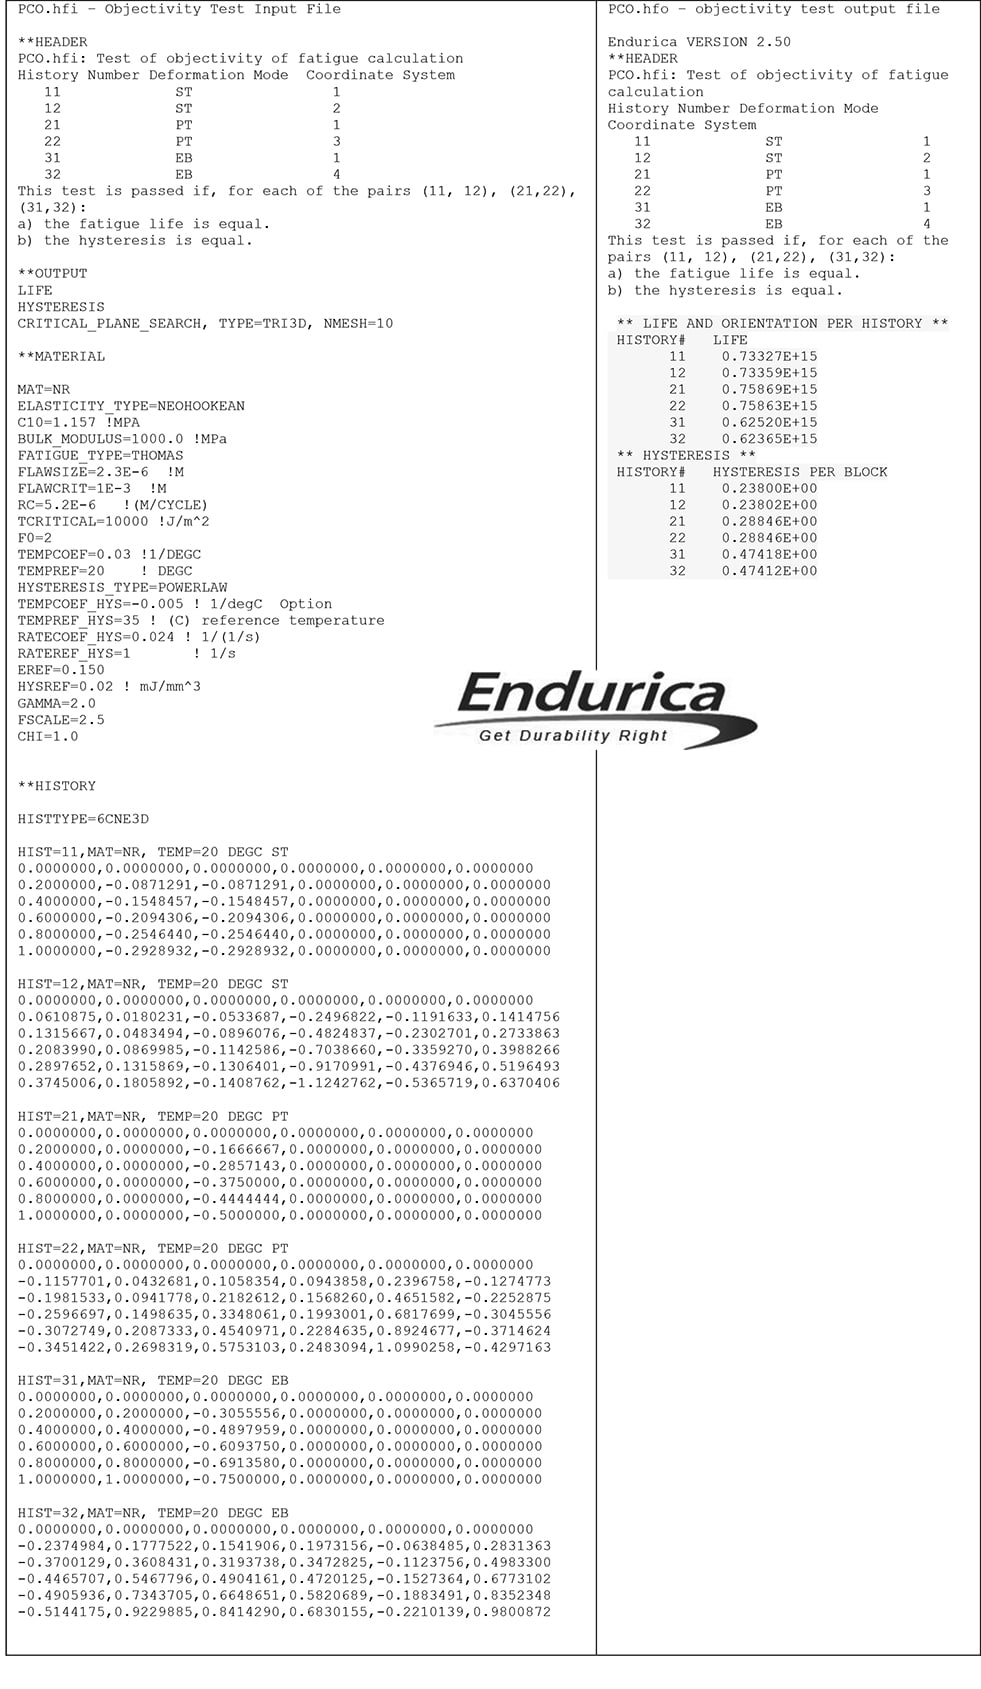
Software verification, benchmarking and unit testing.  In addition to the experimental validations mentioned above, each time we build a new version of our software, we execute a series of automated tests.  These tests verify every line of code against expected function, and they ensure that as we add new features, we do not introduce unintended changes.  The benchmarks include tests that verify things like coordinate frame objectivity (rigid rotations under static load should do no damage and the same strain history written in two different coordinate systems should have the same life), and check known results pertaining to material models and cycle counting rules.  You can read more about our software quality processes here.

It is safe to say that no other solution for fatigue life prediction of rubber has been tested and validated against a larger number of applications than Endurica’s.

References

Aıt-Bachir, M. “Prediction of crack initiation in elastomers in the framework of Configurational Mechanics.” PhD diss., Ph. D. thesis, Ecole Centrale de Nantes, Nantes (France), 2010.

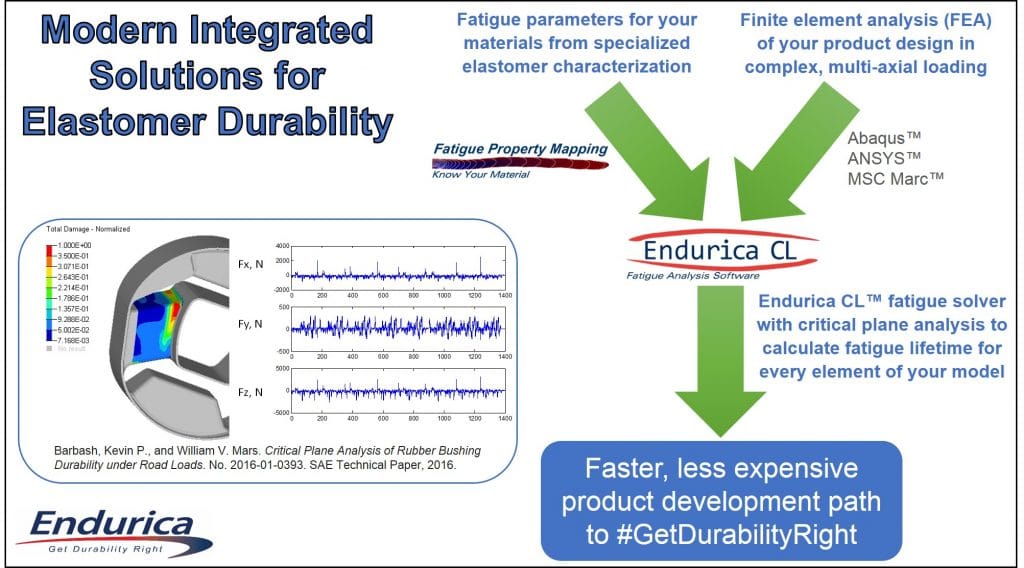
Barbash, Kevin P., and William V. Mars. Critical plane analysis of rubber bushing durability under road loads. No. 2016-01-0393. SAE Technical Paper, 2016.

Belkhiria, Salma, Adel Hamdi, and Raouf Fathallah. “Cracking energy density for rubber materials: Computation and implementation in multiaxial fatigue design.” Polymer Engineering & Science (2020).

Cadwell, S. M., R. A. Merrill, C. M. Sloman, and F. L. Yost. “Dynamic fatigue life of rubber.” Rubber Chemistry and Technology 13, no. 2 (1940): 304-315.

Choi, I. S., and C. M. Roland. “Intrinsic defects and the failure properties of cis-1, 4-polyisoprenes.” Rubber chemistry and technology 69, no. 4 (1996): 591-599.

Fielding, J. H. “Flex life and crystallization of synthetic rubber.” Industrial & Engineering Chemistry 35, no. 12 (1943): 1259-1261.

Goossens, J.R., Mars, W., Smith, G., Heil, P., Braddock, S. and Pilarski, J., 2017. Durability Analysis of 3-Axis Input to Elastomeric Front Lower Control Arm Vertical Ride Bushing (No. 2017-01-1857). SAE Technical Paper. https://doi.org/10.4271/2017-01-1857

Goossens, Joshua R., and William V. Mars. “Finitely Scoped, High Reliability Fatigue Crack Growth Measurements.” Rubber Chemistry and Technology 91, no. 4 (2018): 644-650. https://doi.org/10.5254/rct.18.81532

Harbour, Ryan Joseph. Multiaxial deformation and fatigue of rubber under variable amplitude loading. Vol. 67, no. 12. 2006.

Harbour, Ryan J., Ali Fatemi, and Will V. Mars. “Fatigue crack orientation in NR and SBR under variable amplitude and multiaxial loading conditions.” Journal of materials science 43, no. 6 (2008): 1783-1794.

Huneau, Bertrand, Isaure Masquelier, Yann Marco, Vincent Le Saux, Simon Noizet, Clémentine Schiel, and Pierre Charrier. “Fatigue crack initiation in a carbon black–filled natural rubber.” Rubber Chemistry and Technology 89, no. 1 (2016): 126-141.

Lake, G. J., and P. B. Lindley. “Cut growth and fatigue of rubbers. II. Experiments on a noncrystallizing rubber.” Journal of Applied Polymer Science 8, no. 2 (1964): 707-721.

Li, Fanzhu, Jinpeng Liu, W. V. Mars, Tung W. Chan, Yonglai Lu, Haibo Yang, and Liqun Zhang. “Crack precursor size for natural rubber inferred from relaxing and non-relaxing fatigue experiments.” International Journal of Fatigue 80 (2015): 50-57.

Mars, William Vernon. Multiaxial fatigue of rubber. 2001.

Mars, Will V. “Cracking energy density as a predictor of fatigue life under multiaxial conditions.” Rubber chemistry and technology 75, no. 1 (2002): 1-17.

Mars, W. V., and A. Fatemi. “Analysis of fatigue life under complex loading: Revisiting Cadwell, Merrill, Sloman, and Yost.” Rubber chemistry and technology 79, no. 4 (2006): 589-601.

Mars, W. V., and A. Fatemi. “Nucleation and growth of small fatigue cracks in filled natural rubber under multiaxial loading.” Journal of materials science 41, no. 22 (2006): 7324-7332.

Mars, W. V. “Computed dependence of rubber’s fatigue behavior on strain crystallization.” Rubber Chemistry and Technology 82, no. 1 (2009): 51-61. https://doi.org/10.5254/1.3557006

Mars, William V., Matthew Castanier, David Ostberg, and William Bradford. “Digital Twin for Tank Track Elastomers: Predicting Self-Heating and Durability.” In Proceedings of the 2017 Ground Vehicle Systems Engineering and Technology Symposium (GVSETS). 2017.pdf here

Mars, W. V., and M. Isasi. “Finitely scoped procedure for generating fully relaxing strain-life curves.” In Constitutive Models for Rubber XI: Proceedings of the 11th European Conference on Constitutive Models for Rubber (ECCMR 2019), June 25-27, 2019, Nantes, France, p. 435. CRC Press, 2019.

Muhr, A. H. “Modeling the stress-strain behavior of rubber.” Rubber chemistry and technology 78, no. 3 (2005): 391-425.Lake and Thomas 1967

Ramachandran, Anantharaman, Ross P. Wietharn, Sunil I. Mathew, W. V. Mars, and M. A. Bauman. “Critical Plane Selection Under Nonrelaxing Simple Tension with Strain Crystallization.” In Fall 192nd Technical Meeting of the Rubber Division, pp. 10-12. 2017.

Rivlin, R. S., and A. G. Thomas. “Rupture of rubber. I. Characteristic energy for tearing.” Journal of polymer science 10, no. 3 (1953): 291-318.Gent, Lindley and Thomas, 1964

Roberts, B. J., and J. B. Benzies. “The relationship between uniaxial and equibiaxial fatigue in gum and carbon black filled vulcanizates.” Proceedings of rubbercon 77, no. 2 (1977): 1-13.

Robertson, Christopher G., Lewis B. Tunnicliffe, Lawrence Maciag, Mark A. Bauman, Kurt Miller, Charles R. Herd, and William V. Mars. “Characterizing Distributions of Tensile Strength and Crack Precursor Size to Evaluate Filler Dispersion Effects and Reliability of Rubber.” Polymers 12, no. 1 (2020): 203. Pdf here

Saintier, Nicolas, Georges Cailletaud, and Roland Piques. “Multiaxial fatigue life prediction for a natural rubber.” International Journal of Fatigue 28, no. 5-6 (2006): 530-539.

Tobajas, Rafael, Daniel Elduque, Elena Ibarz, Carlos Javierre, and Luis Gracia. “A New Multiparameter Model for Multiaxial Fatigue Life Prediction of Rubber Materials.” Polymers 12, no. 5 (2020): 1194.

Zarrin-Ghalami, Touhid, Sandip Datta, Robert Bodombo Keinti, and Ravish Chandrashekar. Elastomeric Component Fatigue Analysis: Rubber Fatigue Prediction and Correlation Comparing Crack Initiation and Crack Growth Methodologies. No. 2020-01-0193. SAE Technical Paper, 2020.


twitterlinkedinmail

Two Decades of Critical Plane Analysis

Critical Plane Analysis

It has been 20 years since Critical Plane Analysis for rubber was first conceived and validated.  There were early signs of its significance.  It won awards wherever I presented it. At the 1999 SAE Fatigue Design and Evaluation meeting, it won the Henry Fuchs award.  At the 2000 Tire Society meeting, it won the Superior Paper award. At the Fall 2000 ACS Rubber Division meeting, it won the Best Paper award.  Upon completing my 2001 doctoral thesis, we applied for and received a US patent (2003) on it.

The strongest early sign was that I soon found myself in company with others pursuing similar thinking.  The earliest was Dr. Nicolas Saintier.  As far as I know, neither of us was aware of the other’s work until 2006.  That was when he published an account similar enough to my own that when it came across my desk and I first started to read it, I felt certain he would cite my 2001 work as a source.  I have to admit to initially feeling let down when I reached the end of his paper and found no mention of my work.  I immediately looked for his other papers and found his 2001 doctoral thesis titled “Fatigue multiaxiale dans un élastomère de type NR chargé: mécanismes d’endommagement et critère local d’amorçage de fissure.” (Multiaxial fatigue life of a natural rubber: crack initiation mechanisms and local fatigue life criterion).  There it was – the same founding principle of Critical Plane Analysis that I had worked so hard to articulate and validate – the idea that cracks develop on a material plane, specifically the most critical material plane, and that their localized experience drives their evolution.  That we both articulated this beautifully simple and powerful principle in the same year with complete independence from each other, when no one else working on elastomers had yet spoken of this approach (there were precedents in the field of metal fatigue analysis), just shows that it was an idea whose time had come.

Although the foundational principle of Critical Plane Analysis was the same, there were also important differences between our accounts.  We differed on 1) how the critical plane is selected, 2) what criterion is used to quantify the severity of loading experience by the critical plane, 3) how damage on the critical plane evolves under solicitation.  The following table summarizes the key differences:


Table 1. Comparison of the Mars and Saintier Frameworks for Critical Plane Analysis.

Mars 2001 Saintier 2001
Critical Plane Selection Method Minimize the computed life after evaluation of damage on all planes Maximize the principal stress prior to evaluation of damage
Multiaxial Criterion Energy release rate estimated via cracking energy density on every plane Stress traction on the assumed critical plane
Damage Evolution Law Integration of crack growth rate law Power law Wohler curve
Strain Crystallization Law Treated as R ratio dependence of the crack growth rate law Treated as a modifier of the stress experienced on the critical plane

It may be said that Saintier’s approach followed more closely the precedents for Critical Plane Analysis in metal fatigue, particularly with respect to the method used to select the critical plane.  Selecting the plane is the first step in his method (identify the plane in order to compute the damage), but it is the last step in our method (compute the damage on each plane first and lastly pick the plane with the most damage).  Saintier’s approach also depends on a Wohler curve style characterization of fatigue behavior, where ours is defined via a crack growth rate law.  We have previously discussed the pros and cons of Wohler curves vs. fracture mechanics.  In our approach, we placed a high priority on taking advantage of the very large pre-existing body of knowledge on the fracture mechanical behavior of elastomers, and on the economic and operational advantages that crack growth experiments enjoy.

Since my and Saintier’s first steps, there have now been many others who have contributed in various forms to the overall method, its validation and/or its application.  It is safe to say that Critical Plane Analysis is here to stay, and set to continue expanding for many years (there are now several hundred research papers!).

For our part, Endurica is now in year 12 of delivering commercial grade fatigue analysis solutions built on this method.  Today, Critical Plane Analysis is a production analysis workflow used by many engineering organizations to solve critical durability issues.  It is the heart of the Endurica fatigue solver, and there are hundreds of trained users (look up the #fatigueninjas on twitter!).  It is unrivaled for its reliability, speed and accuracy in computing the impacts of multiaxial loading on durability.

What do the next 20 years hold?  We are going to see a transition in how fatigue analysis is used.  OEM organizations that manage durability and risk across rubber component supply chains will transition away from receiving fatigue simulation results on an optional basis towards requiring fatigue simulations by default on every part at the inception of new programs.  Expectations and achievement of cost-reduction, light weighting and sustainability initiatives will increase as product optimization begins to fully account for actual product use cases.  Critical Plane Analysis has already laid the foundation for these things to happen.  Older fatigue analysis methods that do not compete well against critical plane methods will become obsolete.  On the research side, there will be further development of material models for use in the critical plane framework.  Ageing, inelasticity, rate and anisotropy effects still need further development, for example.  In 20 years, durability will be just one more thing that engineers do well every day, whether or not they know that Critical Plane Analysis was how they did it.

Mars, W. V,  Multiaxial fatigue of rubber. Ph.D. Dissertation, University of Toledo, 2001.

Mars, W. V. “Multiaxial fatigue crack initiation in rubber.” Tire Science and Technology 29, no. 3: 171-185, 2001.

Mars, W. V. “Cracking energy density as a predictor of fatigue life under multiaxial conditions.” Rubber chemistry and technology 75, no. 1: 1-17, 2002.

Mars, W. V., “Method and article of manufacture for estimating material failure due to crack formation and growth.” U.S. Patent No. 6,634,236. 21 Oct. 2003.

Saintier, N, “Fatigue multiaxiale dans un élastomère de type NR chargé: mécanismes d’endommagement et critère local d’amorçage de fissure.” Ph. D Dissertation., Ecole des Mines de Paris, 2001.

Saintier, N, G. Cailletaud, R. Piques. “Crack initiation and propagation under multiaxial fatigue in a natural rubber.” International Journal of Fatigue 28, no. 1: 61-72, (2006).

twitterlinkedinmail

Conservatism and Tradition in Fatigue Analysis

Slide Rule

Because Endurica’s Critical Plane Analysis is a relatively new approach to fatigue analysis of elastomers (introduced in 2001), new users often ask whether its predictions are conservative: i.e., does its predictions reliably lean in favor of safety? And is it more or less conservative than the traditional approaches it supplants?

Fatigue analysis for elastomers follows two distinct traditions.  The earliest tradition traces to Sidney Cadwell’s work in 1940 which followed the even earlier ideas of metal fatigue pioneer August Wohler.  This tradition is based on matching up empirical crack nucleation curves to corresponding in-service operating conditions via convenient parameters such as stress or strain.  It is typically the first approach that engineers encounter in their undergraduate training, as it is often effective and relatively simple to apply.  A later tradition, Fracture Mechanics, traces to the post-WWII work of Ronald Rivlin and Alan Thomas in 1953 which extended Griffith’s seminal 1921 work on rupture to elastomers.  In this tradition, the energy requirements for growing a given crack provide the core organizing principle for analysis.  Combined with empirical crack growth rate curves, this approach can make high accuracy life predictions for a very broad range of application scenarios. This approach is typically first encountered in graduate-level engineering programs, and due to somewhat more complicated mathematics, usually requires specialized calculation software to apply it.

There are a few big holes in the Wohler curve approach.  For elastomers, perhaps the biggest limitation is that this approach assumes a priori that damage is associated with the maximum principal stress or strain.  This is sometimes true for simple cases, but not always: 1) strain crystallization is known to produce off-axis cracking not aligned with the principal stress, 2) compression is known to produce cracks on planes of maximum shearing, and 3) out-of-phase multiaxial loading cases do not even possess a unique, well-defined principal direction – the directions vary in time.  It is also well known that Wohler curves for rubber depend strongly on mode of deformation.  Fatigue experiments in simple tension, biaxial tension, simple shear, and simple compression do not simply resolve to a single universal curve, as the Wohler approach takes for granted.  To use this approach conservatively then requires that the most damaging mode of deformation – simple tension – be used as the baseline.

Perhaps the biggest limitation of the traditional Fracture Mechanics approach is that it typically focuses on only one crack at a time.  In fatigue, structures begin with many microscopic cracks distributed randomly throughout.  Most of the fatigue life of the structure is spent growing many small cracks.  Only towards the very end of life do one or a few large cracks finally emerge as worst cases.  True conservatism would mean tracking the growth of all of possible large cracks, and finding out which one(s) grow the fastest.  But traditional fracture mechanics tools are not well adapted for this task.  They require up front assumptions about the location and shape of the worst case crack.  How can you find a worst case without considering many alternatives?

Critical Plane Analysis is simply the idea that a crack could occur anywhere in a structure, and it could occur in any orientation.  It checks all of the possibilities, and it finds the worst ones.  It looks at the specific loading experiences of each individual crack plane that might occur.  It takes account of material behavior like strain crystallization.  It takes account of crack closure conditions.  It takes account of the fracture mechanical behavior of small cracks.  It does not make unwarranted assumptions about the orientation of cracks.  It correctly predicts the orientation of cracks for all modes of deformation.  It is the most exhaustive and conservative fatigue analysis that you can do.

Don’t mistake traditional approaches with the conservative approach.  Critical Plane Analysis is, by definition, the most conservative approach because it doesn’t make any assumptions about crack location or orientation, and because it checks all of the possible ways a crack might occur.

twitterlinkedinmail

Integrated Durability Solutions for Elastomers

Will the durability of your new rubber product meet the expectations of your customers? 

Do you have a comprehensive capability that fully integrates all of the disciplines required to efficiently achieve a targeted durability spec?

Your engineers use finite element analysis (FEA) to model the elastomer component in the complex geometry and loading cycle for the desired product application.  One traditional approach to predicting durability is to develop a rough estimate of lifetime by looking at maximum principal strain or stress in relation to strain-life or stress-life fatigue curves obtained for the material using lab specimens in simple tension.  The difficulties and uncertainties with this method were discussed in a recent blog post.

a rough estimate of lifetime by looking at maximum principal strain or stress in relation to strain-life or stress-life fatigue curves obtained for the material using lab specimens in simple tension


A modern approach to elastomer durability is to use the Endurica CL™ durability solver for FEA.  This software uses rubber fracture mechanics principles and critical plane analysis to calculate the fatigue lifetime – which is the number of times the complex deformation cycle can be repeated before failure – for every element of the model.  This provides engineers with the ability to view lifetime throughout the FEA mesh, allowing them to modify design features or make material changes as needed to resolve short-lifetime areas.

view lifetime throughout the FEA mesh, allowing them to modify design features or make material changes as needed to resolve short-lifetime areas.

A sound finite element model of the elastomer product in the specified loading situation and fundamental fatigue material parameters from our Fatigue Property Mapping™ testing methods are the two essential inputs to the Endurica CL software.  This is illustrated in the figure below.

A sound finite element model of the elastomer product in the specified loading situation and fundamental fatigue material parameters from our Fatigue Property Mapping™ testing methods are the two essential inputs to the Endurica CL software.

The requisite elastomer characterization methods can be conducted by us through our testing services or by you in your laboratory with our testing instruments.  For some companies, consulting projects are a route to taking advantage of the software before deciding to license the unique predictive capabilities.  The following diagram shows how our products and services are integrated.

Durability Solutions for Elastomers

For companies that are just getting started with implementing our durability solutions, the following is a typical testing services and consulting project:

  1. We use our Fatigue Property Mapping™ testing methods, through our collaboration with Axel Products Physical Testing Services, to characterize the properties of cured sheets of rubber compounds sent to us by the client. The minimum requirements for fatigue modeling are crack precursor size and crack growth rate law, and these are quantified within our Core Fatigue Module.  Special effects like strain-induced crystallization and aging/degradation are accounted for using other testing modules when applicable.
  2. The client sends us the output files from their finite element analysis (FEA) of their elastomer part design for the deformation of their complex loading cycle. It is common for the goal to be a comparison of either two designs, two distinct loading profiles, two different rubber compounds, or combinations of these variations.  Our software is fully compatible with Abaqus™, ANSYS™, and MSC Marc™, so the simulations can be conducted on any of these FEA platforms.  In some situations where a client does not have their own FEA capabilities, one of Endurica’s engineers will set up the models and perform the analyses instead.
  3. The fatigue parameters and FEA model are inputted to Endurica CL fatigue solver to calculate values of the fatigue lifetime for every element of the model. The lifetime results are then mapped back onto the finite element mesh in Abaqus, ANSYS, or MSC Marc so that the problem areas (short lifetime regions) within the geometry can be highlighted.
  4. We review the results with the client and discuss any opportunities for improving the fatigue performance through design and material changes.

Advanced implementors of our durability solutions have licensed the Endurica CL software and are using our rubber characterization methods in their laboratories on a routine basis, with instruments provided through our partnership with Coesfeld GmbH & Co. (Germany).  One recently publicized example of a company using the Endurica approach to a very high degree is Tenneco Inc., which you can read about here.

We want to help you #GetDurabilityRight, so please contact us at info@endurica.com if you would like to know more about how Endurica’s modern integrated durability solutions for elastomers can help enable a product development path that is faster, less expensive, and more confident.

twitterlinkedinmail

Tire Society 2017 – Best Question

Best Question Answer | 56.8 C - Peak temperature | N = 3.8E7 cycles = 131E3 km Cycles to 1 mm Crack

Every year, the top minds from academia, government and industry gather in Akron to share their work at the Tire Society annual meeting, and to enjoy a few moments of professional camaraderie.  Then we all return to fight for another year in the trenches of the technology wars of our employers.

This year, the meeting offered the latest on perennial themes: modal analysis, traction, materials science, noise, simulation, wear, experimental techniques for material characterization and for model validation.  Too much to summarize with any depth in a blog post.  If you are interested, you should definitely resolve to go next year.  Endurica presented two papers this year.

I presented a demonstration of how the Endurica CL fatigue solver can account for the effects of self-heating on durability in a rolling tire.  Endurica CL computes dissipation using a simple microsphere model that is compatible, in terms of discretization of the shared microsphere search/integration domain, with the critical plane search used for fatigue analysis.  In addition to defining dissipative properties of the rubber, the user defines the temperature sensitivity of the fatigue crack growth rate law when setting up the tire analysis.  In the case considered, a 57 degC temperature rise was estimated, which decreased the fatigue life of the belt edge by a factor of nearly two, relative to the life at 23 degC.  The failure mode was predicted at the belt edges.  For 100% rated load, straight ahead rolling, the tire was computed to have a life of 131000 km.

The best audience question was theoretical in nature: are the dissipation rates and fatigue lives computed by Endurica objective under a coordinate system change?  And how do we know?  The short answer is that the microsphere / critical plane algorithm, properly implemented, guarantees objectivity.  It is a simple matter to test: we can compute the dissipation and fatigue life for the same strain history reported in two different coordinate systems.  The dissipation rate and the fatigue life should not depend on which coordinate system is used to give the strain history.

For the record, I give here the full Endurica input (PCO.hfi) and output (PCO.hfo) files for our objectivity benchmark.  In this benchmark, histories 11 and 12 give the same simple tension loading history in two different coordinate systems.  Likewise, 21 and 22 give a planar tension history in two coordinate systems.  Finally, 31 and 32 give a biaxial tension history in two coordinate systems.  Note that all of the strain histories are defined in the **HISTORY section of the .hfi file.  In all cases, the strains are given as 6 components of the nominal strain tensor, in the order 11, 22, 33, 12, 23, 31.  The shear strains are given as engineering shear components, not tensor (2*tensor shear = engineering shear).

The objectivity test is successful in all cases because, as shown in the output file PCO.hfo, both the fatigue life, and the hysteresis, show the same values under a coordinate system change.  Quod Erat Demonstrondum.

ObjectivityTable

the full Endurica input (PCO.hfi) and output (PCO.hfo) files for the objectivity benchmark


twitterlinkedinmail

Durability Analysis in CAE: panel discussion of metals vs. polymers at the SAE World Congress

Two graphs depicting the relationship between cycles and tearing energy. Through these graphs they show a relationship between a facture mechanics experiment and a crack nucleation experiment.

The relationship between crack nucleation and fracture mechanics experiments for polymers was first documented in 1964 by Gent, Lindley and Thomas (Journal of Applied Polymer Science, 8, 455, 1964.) 

Some weeks ago, I attended the WCX 2017 SAE World Congress and Exhibition, where a Technical Expert Panel Discussion on the topic of Durability Analysis in CAE was held.  The panel was moderated by Yung-Li Lee (FCA US LLC), and included topic experts Abolhassan Khosrovaneh (General Motors LLC), Xuming Su (Ford Motor Co., Ltd.), and Efthimio Duni (FCA EMEA). The discussion was excellent and wide ranging, owing both to the panelists, and also to the audience, which (judging by the high engagement) was very well versed with the core of the topic, as well as its frontiers. I will not attempt to give a complete summary of the event, but I do want to highlight a memorable discussion thread, and to offer a few thoughts.

I do not know who raised the topic.  It could have been a doctoral student or young professional.  Clearly, it was a person wanting to align his own efforts well relative to larger industry trends.  He started out with the observation that the classical crack nucleation methods (in which fatigue behavior is defined by a stress-life or strain-life curve) are quite popular in the automotive sector for analyzing fatigue of metals.  He also observed that modern tools for rubber take a different approach based upon a fracture mechanics method (in which fatigue behavior is defined by a crack growth rate curve). He then asked (I’m paraphrasing from memory here):

  • Which method (nucleation vs. fracture mechanics) is preferred for analysis of polymers?
  • Should we try to unify all testing and analysis efforts for metals and polymers under the same method?

The panelists made several points in responding to this prompt. They started with the point that differences in methodology may be hard to avoid, if only because metals and polymers are so different in composition, molecular structure, and microstructure.  Of course, it is possible to use fracture mechanical methods with metals, although there are some limitations implied by the granular crystalline structure of metals when cracks are very small.  Likewise, it is also possible to use stress-life methods with polymers, although certain aspects of the material behavior may be incompatible with the usual procedures, leading to questionable results.  From a practical standpoint, it would be quite difficult to change the methods used by the industry for metal fatigue analysis – the methods are quite mature at this point, and they have been implemented and validated across so many codes and projects that it is hard to imagine what could be gained by making a change.  For polymers, CAE durability methods are newer, and we should use what works.

There is a final point that I believe will ultimately define how this all plays out.  It is that 1) fatigue analysis for polymers is usually driven by multiple “special effects”, and that 2) the economics of the testing required to characterize these effects scales very differently between the two approaches.

Let me illustrate with a typical example:  we have a Natural Rubber compound used in a high temperature application, for an extended time, under nonrelaxing loads.  Let’s compare our options:


Option 1

Stress-Life Method

Option 2

Fracture Mechanics + Critical Plane Method

To use the stress-life method, we will need to develop curves that give the effect of 4 parameters on the fatigue life: 1) strain amplitude, 2) mean strain, 3) temperature, and 4) ageing.  The experiment is a simple cycle-until-rupture procedure, with one test specimen consumed per operating condition tested.


Let’s assume that we measure each of the four parameters at only 3 levels, and that we will require 3 replicates of each experiment.  The total number of fatigue experiments we need is therefore:


N = 3 amplitudes x 3 means x 3 temperatures x 3 ageing conditions x 3 replicates = 35 = 243 fatigue to failure tests


With the fracture mechanics method, a single run of the experiment solicits the crack at many different operating conditions, enabling observation of the crack growth rate at each condition.  Using Endurica’s standard testing modules, the example testing program (including replication) would require the following procedures:


Core module: 9 experiments (amplitude effect)

Nonrelaxing module: 3 experiments (mean effect)

Thermal module: 12 experiments (temperature effect)

Ageing module: 30 experiments (ageing effect)


243 tests required 54 tests required


In this example, the fracture mechanics method is almost 243/54 = 4.5x more efficient than the stress-life method!  If you need more than 3 levels, or if you have more than 4 key operating parameters, the experimental cost for the stress-life method quickly becomes completely impractical, relative to the fracture mechanics method. Based on these scaling rules, and on the fact that polymers exhibit so many special effects, you can now appreciate why the fracture mechanics method must prevail for polymers.  For metals, the case is less compelling: there aren’t as so many special effects, and the industry testing norms are already well established.

Bottom line: for fatigue of polymers, the economics of testing for ‘special effects’ strongly favors a fracture mechanics approach.  This fact is certain to shape the future development of fatigue life prediction methods for polymers.

twitterlinkedinmail
close
Trial License RequestTrial License RequestTrial License RequestTrial License RequestTrial License Request

Our website uses cookies. By agreeing, you accept the use of cookies in accordance with our cookie policy.  Continued use of our website automatically accepts our terms. Privacy Center