2023 – a Year of Magnitude and Direction

2023 marked year 15 for Endurica.  If I had to pick one word to describe the past year, that word would be “vector”.  Because magnitude and direction.  😊

We updated our core value statement this year.  The first one I ever wrote as part of Endurica’s original business plan listed 3 values: technical leadership, customer focus, and trustworthiness.  Those values served us well for many years and in many ways shaped who we have become.  But it was important this year to take stock again.  We’ve grown 8-fold since I wrote those down!  So our team spent many hours revisiting our shared values and deliberating over which will best define our culture and steer us right going forward.  In the end, we decided to keep the first 3, and we added 3 more:  embrace the grit, make an impact, and better every day.

We also completed an exercise to articulate what makes Endurica truly unique in the CAE / durability simulation space.  The 3 words we chose are… Accurate, Complete, and Scalable.

  • Accurate refers to the accurate material models that capture rubber’s many “special effects”, the accurate critical plane analysis method for analyzing multiaxial history, the accurate handling of nonlinear relationships between global input load channels and local crack experiences, and the extensive set of validation cases that have demonstrated our accuracy over the years. Nobody offers a more accurate solution for rubber durability.
  • Complete refers to our complete coverage of infinite life, safe life and damage tolerant approaches to testing and simulation. It refers to feature completeness that enables users to account for nearly any material behavior under nearly any service conditions.  Finally, it refers to the documentation, the materials database, and the examples we distribute with the software and with our webinar series.  Nobody offers a more complete solution for rubber durability.
  • Scalable refers to our capacity to apply our solutions efficiently in all circumstances. Scalability is the training we provide so that users can learn our tools quickly.  Scalability is access to powerful, ready-to-use workflows right when you need them.  Scalability is the modular approach we take to material testing and modeling so that simple problems can be solved cheaply and complex problems can be solved accurately in the same framework.  Scalability is our multi-threading that allows job execution time to be accelerated to complete impactful analysis on tough deadlines.  Nobody offers a more scalable solution for rubber durability.

2023 was not all navel-gazing and new marketing.  We also had magnitude and direction in other areas.

Top 10 Code Developments:

  1. New Endurica Architecture: After several years of development and a soft launch under the Katana project name, we finally completed our migration to the new architecture.  The new architecture provides a huge speed advantage for single thread and now for multithread execution. It uses a new input file format (.json). The json format makes it easier than ever for users to build customized and automated workflows via Python scripting.
  2. Sequence Effects: Sometimes the order of events matters to durability, and sometimes it doesn’t. We introduced Steps and Blocks to our input file, giving users complete control over the specification of multi-block, multi-step scheduling of load cases.  There is also a new output request that came out of this work: residual strength.
  3. EIE: 6 channels and support for RPC: Support for 6 channels of load input was one of our most highly requested new features.  Fast growing use of this feature led to further enhancements of the workflow (support for rpc file format, studies of map building techniques), and new recommendations on how to implement boundary conditions for specified rotation histories in explicit and implicit finite element models.
  4. Queuing: Design optimization studies need efficient management and execution of multiple jobs. Endurica’s software license manager now supports queueing for licenses. Queuing allows a submitted job to automatically wait to start until a license is available, instead of the prior behavior of exiting with a license error. Now you can submit many jobs without worrying about license availability.
  5. Haigh Diagram Improvements: We implemented an improved discretization of the Haigh diagram, and parallelized its evaluation. Now you get much nicer looking results in a fraction of the time. For details, check out our blog post on Haigh diagrams and also read about other improvements like axis limit setting and smoother contour plots.
  6. Viewer image copy: There is now a button! Its easier than ever to get your images into reports.
  7. Documentation Updates: We have been focusing on improving documentation this year. There are many new sections in the theory manual and user guide, as well as a getting started guide and more examples.  Stay tuned for many more examples coming in 2024!
  8. User Defined Planes: It is now possible to define your own set of planes for the critical plane search. One example where you might want to do this would be the situation where you would like to refine the critical plane search on a limited domain of the life sphere.
  9. New Database Materials: We added 7 new carbon black and silica filled EPDM compounds to the database. We are now up to 42 unique rubber compounds in the database.
  10. Uhyper Support: The new architecture now supports user-defined hyperelasticity. If you have a Uhyper subroutine for your finite element analysis, you can use it directly with Endurica.


Testing Hardware

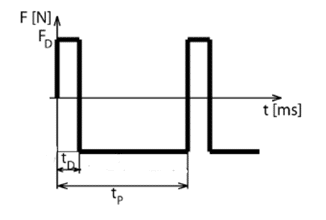
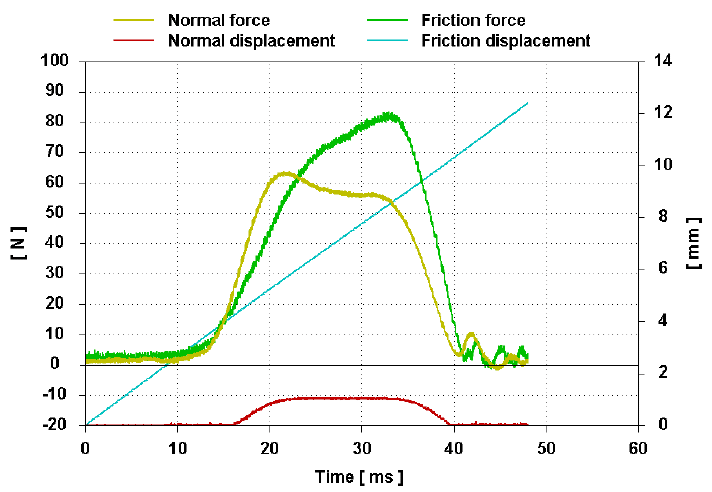
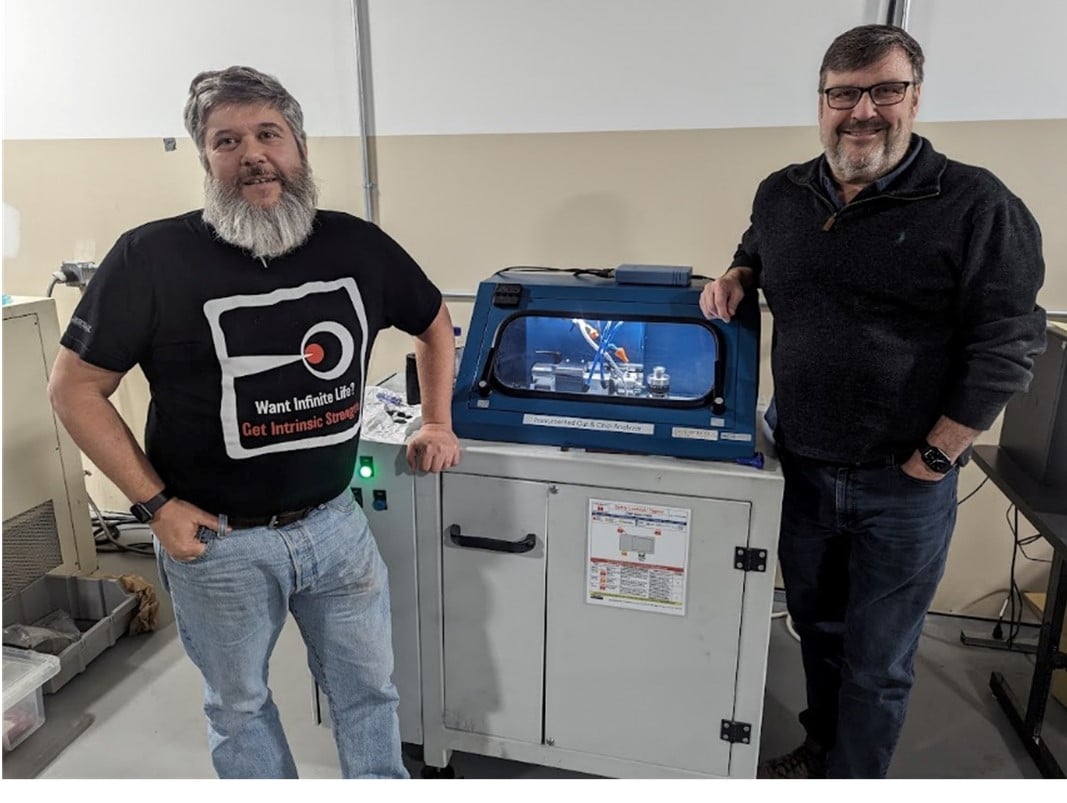
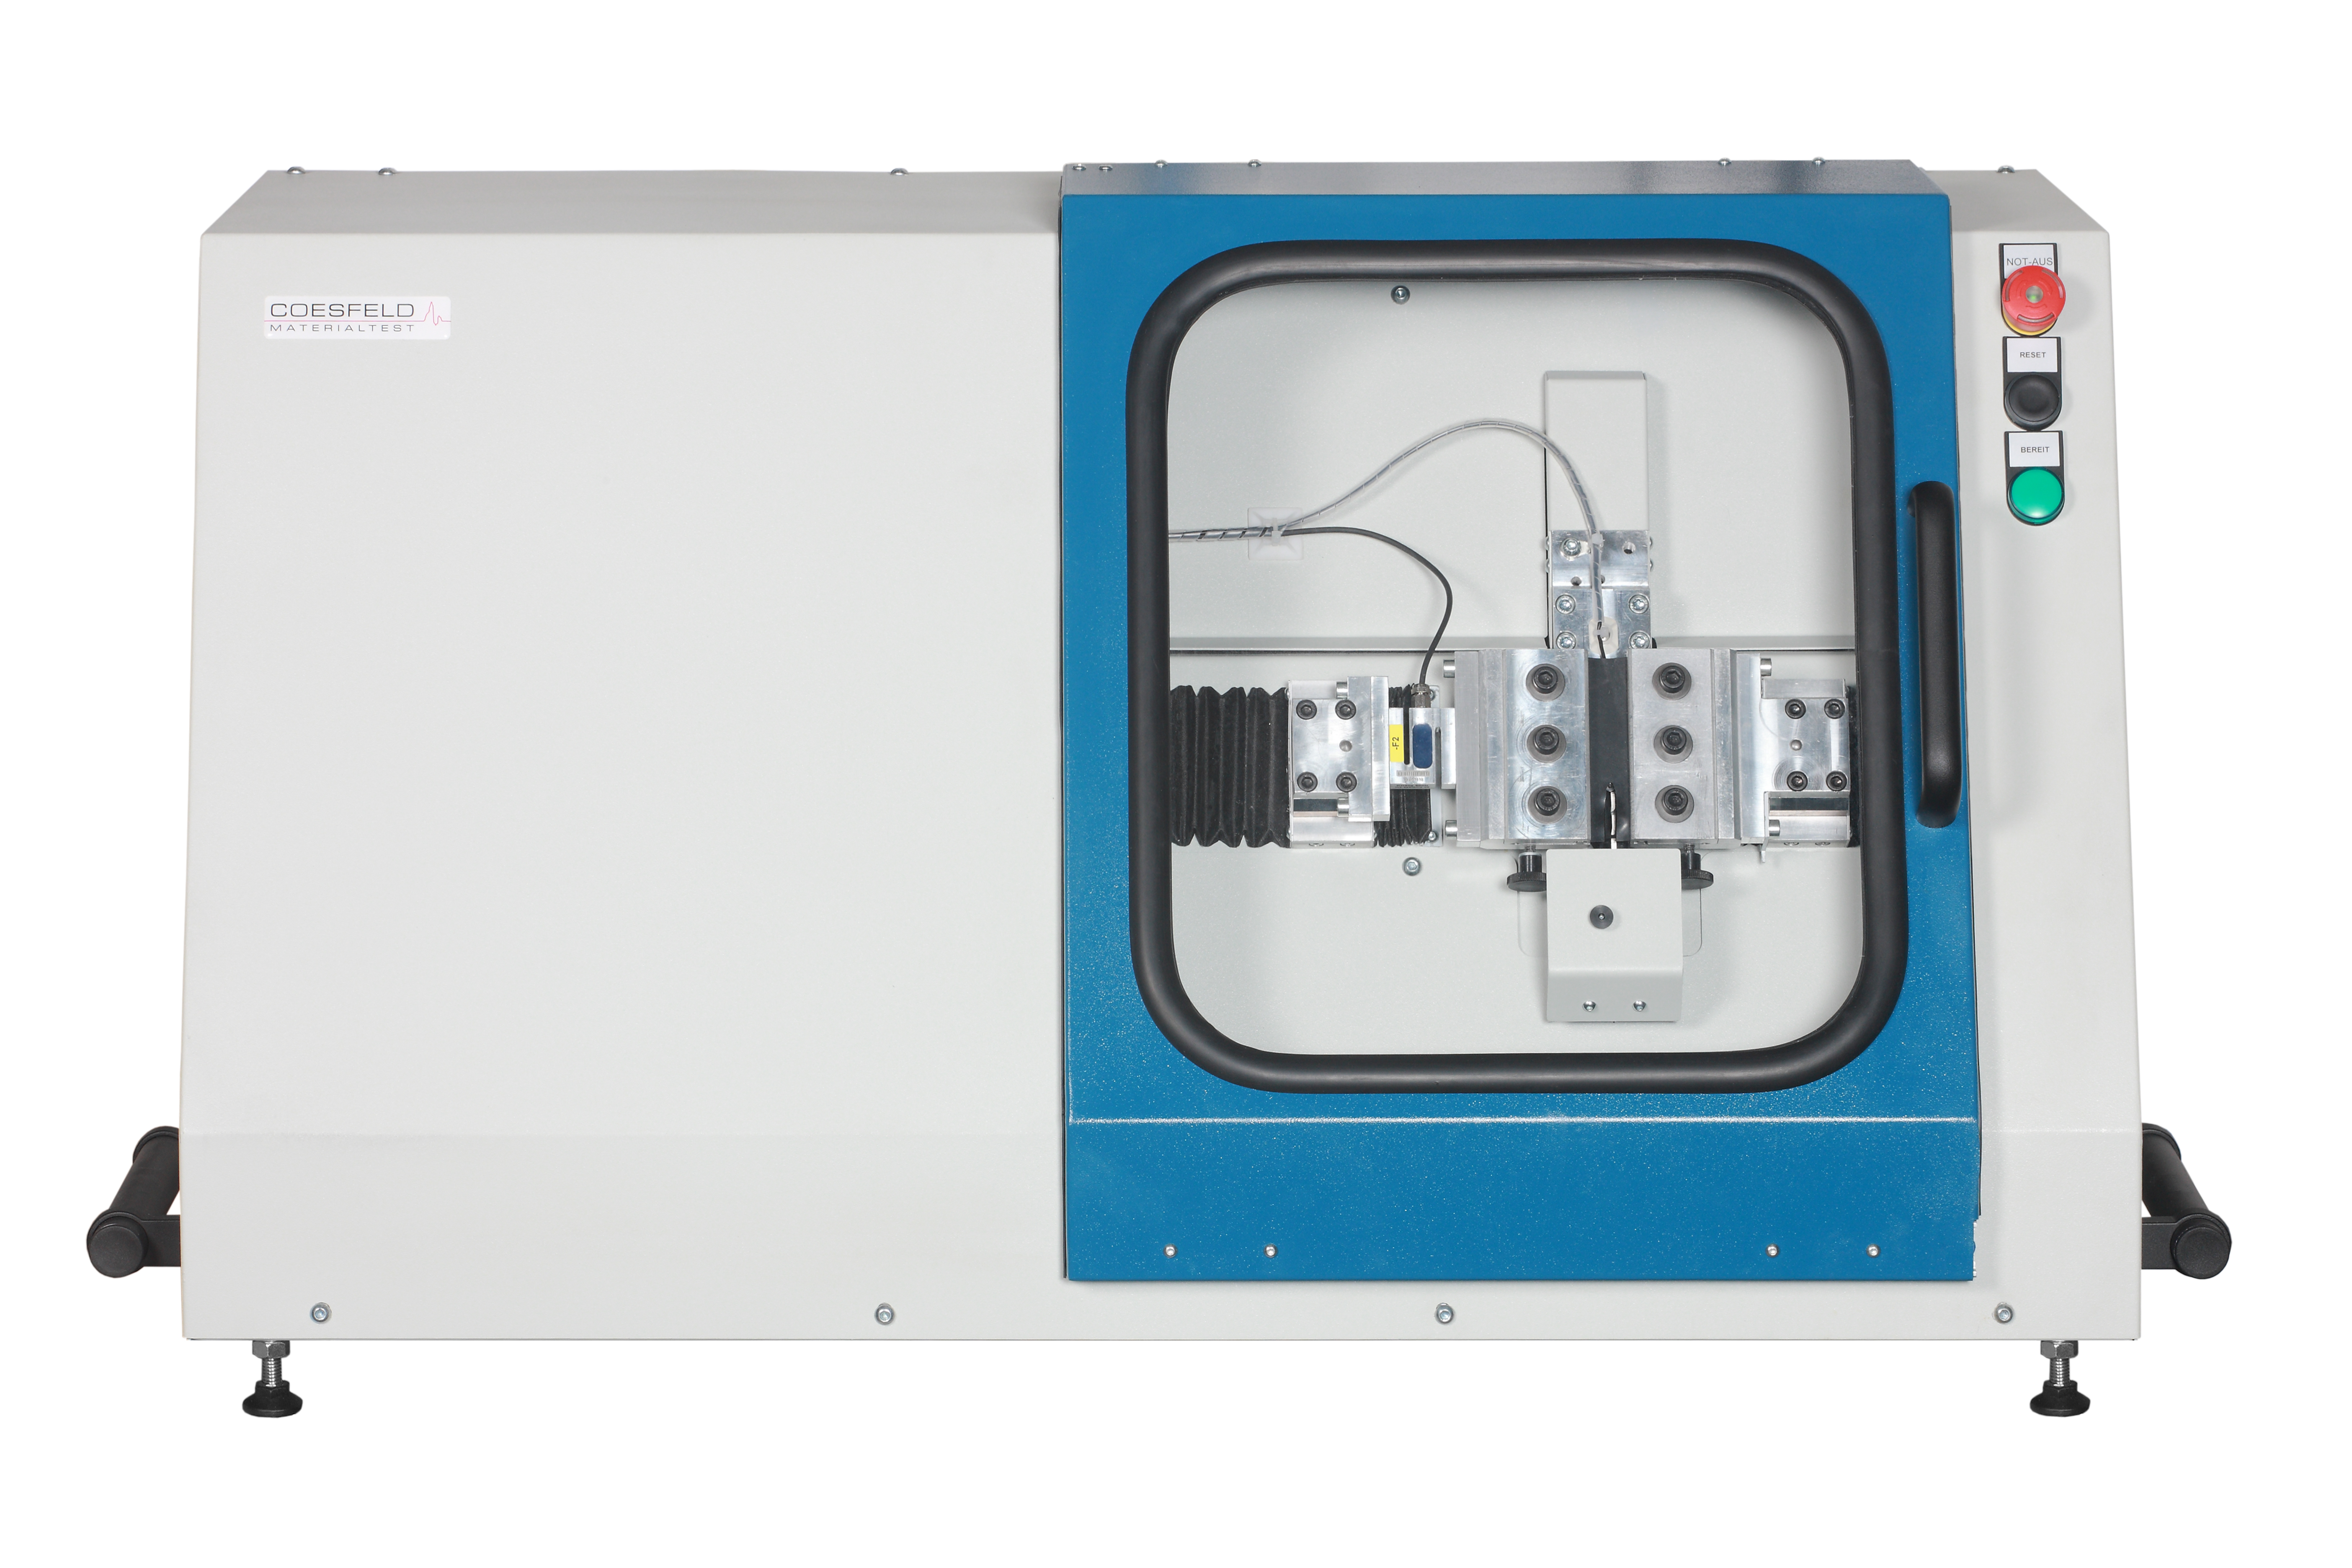
We completed the acquisition and installation at ACE labs of a Coesfeld Instrumented Cut and Chip Analyser (ICCA).  The ICCA provides unmatched measurement and control of impact conditions, and provides a way to evaluate rubber compounds for their resistance to cutting and chipping.


Applications, Case Studies, Webinars

Never underestimate the students! We were blown away by the work of undergraduates at the University of Calgary with our tools and Ansys.  The students designed an airless tire, completing durability simulations using Endurica software within the scope of a senior design project. They were able to Get Durability Right on a short timeline and a student budget. Check out their multi-objective, high-performance design project here.

Analyzing what happens to tires as they take on the most celebrated testing track in the world might have been the funnest project Endurica’s engineers tackled in 2023. We presented the technical details at The Tire Society annual meeting and more in a followup webinar. An extensive Q&A session followed, and I loved the final question: “So, how long before we have a dashboard display of ‘miles to tire failure’ in our cars?”  Bring it.  We are ready!

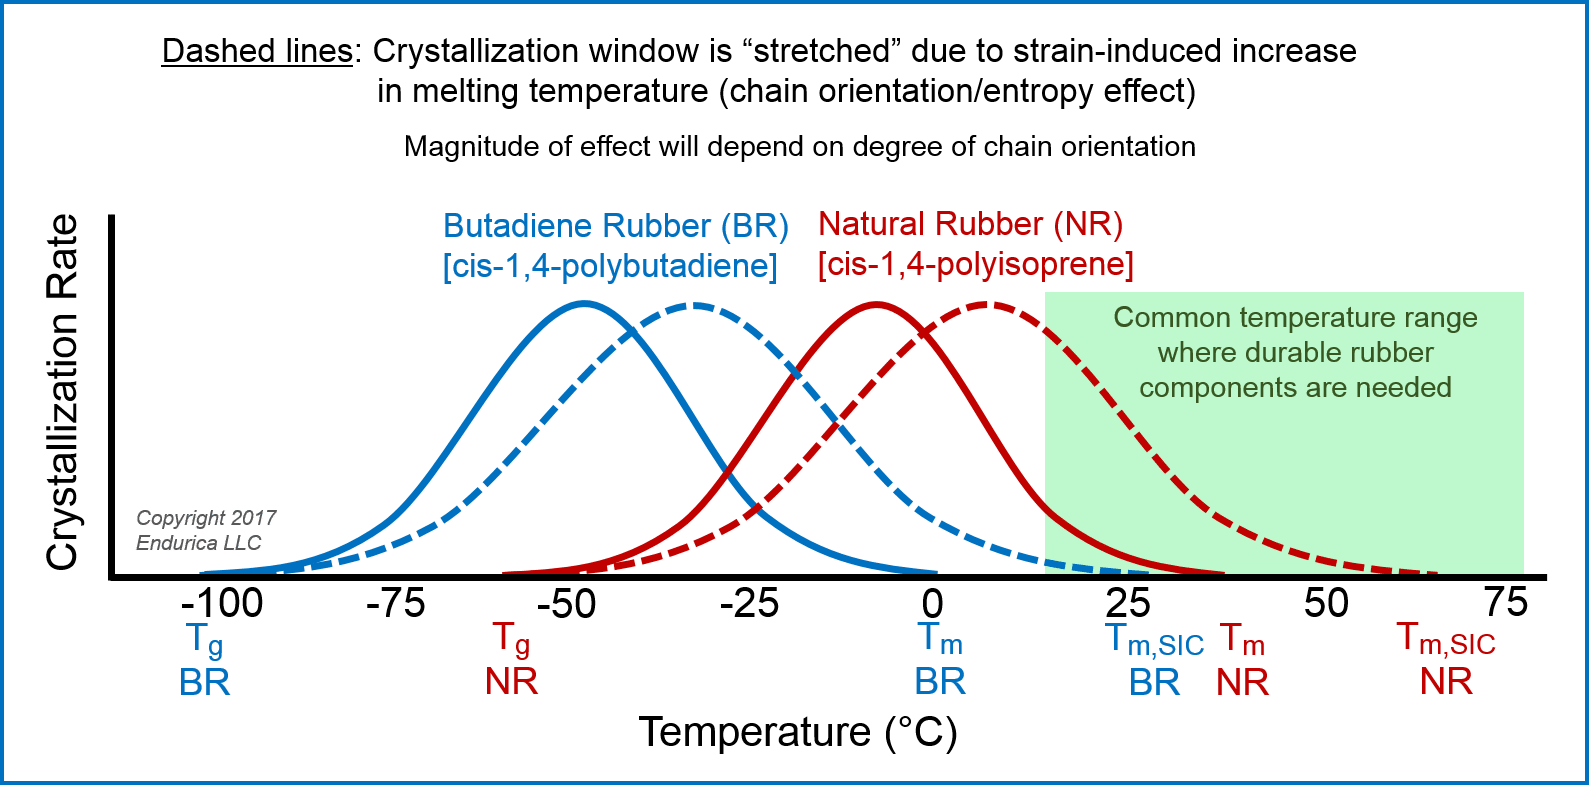
Our Winning on Durability webinar series hit a nerve with the Metal Fatigue DOES NOT EQUAL Rubber Fatigue episodes on mean strain (the tendency of larger mean strains to significantly INCREASE the fatigue life of some rubbers!) and linear superposition (for converting applied load inputs to corresponding stress/strain responses). The great response has lead to our third installment on the differences between rubber and metal fatigue with an upcoming presentation on temperature effects.

twitterlinkedinmail

Latest Addition: the Coesfeld Instrumented Chip & Cut Analyser

When there is rolling or sliding contact of a rubber surface over a second hard surface of sufficient roughness, localized cutting and damage of the rubber surface sometimes becomes a problem.  It occurs in off-road tires operating on stony surfaces, for example, and it can severely limit the useful life of a tire.  In order to study this “cutting and chipping” failure mode, Endurica last month acquired a new testing instrument: the Coesfeld Instrumented Chip & Cut Analyser (or ICCA).  It has been set up at partner lab ACE Laboratories, commissioned, and it is now ready for running tests.

The ICCA test uses a solid rubber wheel specimen.  These are molded from uncured rubber compound supplied by the client.  Alternatively, the mold can be rented if the client prefers to produce their own specimens.  The ICCA test offers direct control and measurement of the following key parameters

  • Wheel revolution speed
  • Overall impact period, tP
  • Peak impact force, FD
  • Contact duration of impact, tD

Figure 1.  Contact force control signal (left).  Coesfeld ICCA impactor tool actuation (right).

It also records the following measurements

  • Normal force
  • Normal displacement
  • Friction force
  • Friction displacement (i.e. wheel rotation)
  • Abrasion depth

Figure 2.  Normal and friction impact forces and displacements during a single impact.

The Coesfeld ICCA instrument improves on J. R. Beatty’s 1979 “BF Goodrich Cut and Chip” (BFG) test in several ways.  Perhaps the chief improvement is that the force and duration of the impact are accurately controlled and measured.  The BFG test suffers from two major problems: 1) that the impact is passively applied by means of a weighted beam whose natural impact frequency is influenced by the stiffness of the rubber compound, and 2) that the impact forces and displacement are not measured and not easily relatable to applications.  By quantifying the impact conditions of the test, the Coesfeld ICCA offers the opportunity to match those of the actual application.

As the Americas distributor for Coesfeld testing instruments, Endurica is proud and excited to add the Coesfeld ICCA to our portfolio of testing services and testing instruments.  Reach out to us today if you have a need for testing services on the ICCA, or if you would like to bring the Coesfeld ICCA to your lab.

Figure 3.  Endurica President Will Mars and Vice President Tom Ebbott with the newly installed Coesfeld ICCA at partner ACE Laboratories.

twitterlinkedinmail

Proper tear testing of elastomers: Why you should tear up the Die C tear test

Endurica Fatigue Ninja tearing rubber

I spent an interesting and rewarding part of my career helping to lead an elastomer technical college in Yanbu, Saudi Arabia. One of the rubber technology words that was challenging for the Saudis to say in English was ‘tear’. They initially pronounced it like the heteronym related to crying. It might be a stretch to say that tears will come to your eyes if you don’t get tear testing of elastomers right, but proper measurement of critical tearing energy (tear strength) is essential for effective materials development for durability.

The fatigue threshold (intrinsic strength; T0) is the lower limit of the fatigue crack growth curve shown in the figure below, and we recently reviewed this material parameter including the various measurement options.1 The upper limit is the tear strength, TC. If loads in your elastomer component are near or above TC, then it is not a fatigue problem anymore but rather a critical tearing issue with imminent product failure. It is therefore important to accurately characterize this durability performance characteristic of your materials.

General fatigue crack growth behavior of elastomers

Endurica uses the planar tension (pure shear) geometry for measuring TC in our Fatigue Property Mapping testing services due to the simple relationship between the strain energy density (W) and the energy release rate (tearing energy, T).2,3 The TC is equal to the W at tearing multiplied by the initial specimen height, h. You can see this geometry below along with other tear testing specimens employed in the rubber industry and specified in the ASTM standard.4

Comparison of the different durability tests one can conduct: the differences between Crack Nucleation Test and Tear and Crack Growth Tests.

We sometimes get questions from folks with technical backgrounds in metals or plastics about whether rubber tear properties will be different when tested in distinct testing modes (mode I, mode II, etc.). It turns out that the extensibility of rubber causes the deformation to be predominately tension in the tearing region, irrespective of how the crack is opened, such that TC values are similar for rubber evaluated in different testing modes.2,3 Therefore, trouser tear testing is an alternative to the planar tension testing, as long as any stretching of the legs is accounted for in the data analysis.3,5 With no stretching of the legs, TC is simply given by 2F/t where F is the measured force to propagate the tear and t is the thickness of the specimen. The factor of 2 is surprisingly omitted in the ASTM standard4 even though it is mentioned in the appendix. The image below shows how to convert the ASTM trouser tear strength to TC.

Trouser tear strength testing

A proper tear test includes an initial macroscopic cut/crack in the specimen. This is not the case for Die C tear described in the tear testing standard.4 Die C is thus not a tear test at all but rather is a crack nucleation experiment akin to normal tensile testing of rubber. Because the strange Die C geometry forces failure in a small region in the center of the specimen, it is actually less useful than tensile strength testing of a dumbbell sample which probes the entire gauge region. The Die C test can also have substantial experimental variability related to the sharpness of the die used to punch out the samples. Unfortunately, the Die C “tear” test is the most popular method in the rubber industry to (incorrectly) assess the tear strength of elastomers, and this reality was a key motivator for writing this post. We look forward to seeing the rubber industry shift away from the Die C test, and we hope that the information provided here will help in that path to #GetDurabilityRight. Click here to learn how intrinsic strength and tear strength can be measured quickly and accurately (0:42 video).

References

  1. Robertson, C.G.; Stoček, R.; Mars, W.V. The Fatigue Threshold of Rubber and its Characterization Using the Cutting Method. Advances in Polymer Science, Springer, Berlin, Heidelberg, 2020, pp. 1-27.
  2. Lake, G.J. Fatigue and Fracture of Elastomers. Rubber Chem. Technol. 1995, 68, 435-460.
  3. Rivlin, R.S.; Thomas, A.G. Rupture of rubber. I. Characteristic energy for tearing. J. Polym. Sci. 1953, 10, 291–318.
  4. Standard Test Method for Tear Strength of Conventional Vulcanized Rubber and Thermoplastic Elastomers. Designation: ASTM D 624-00, ASTM International, West Conshohocken, PA, USA, 2020; pp. 1-9.
  5. Mars, W.V.; Fatemi, A. A literature survey on fatigue analysis approaches for rubber. Int. J. Fatigue 2002, 24, 949–961.
twitterlinkedinmail

Things that went right in 2020 at Endurica

Things that went right in 2020 at Endurica

2020 is burned in all our minds as a chaotic and tough year.  Just like the rest of the world, Endurica staff experienced times of isolation and loss due to the pandemic.  On a positive note, we invested heavily in making our tools and workflows better than ever so that we’re ready to come back strong in 2021.  Here is a list of our top new developments in 2020:

Endurica Software Enhancements

  • Endurica DT’s new Ageing Feature now enables you to simulate how ageing affects your rubber product. Your compound’s stiffness, strength, and fatigue properties can all evolve with time.
  • Our new Linux distribution takes our solutions beyond the Windows world.
  • We’ve added an encryption feature to safeguard your trade secrets.
  • Viewer Improvements make it easier than ever to visualize your fatigue simulation results.
  • EIE Enhancements give you blazing-fast compute speed for full road-load signals.
  • We’ve also planned an aggressive development agenda for 2021. Stay tuned for a new Endurica-based smartphone app for materials engineers, for a new feature that computes fatigue threshold safety margins, for a new block cycle schedule extraction algorithm, and more!

Training

  • The new Fatigue Ninja Friday webinar series provides step-by-step application training for key the workflows that you need to get durability right. All of the recorded episodes are now available in the online Endurica academy.
  • The new Winning on Durability webinar series provides high-level overviews of both technical and business topics so you can connect Endurica tools to your strategic imperatives. All of these recorded webinars are available gratis on our website.
  • We’ve recast our in-person training events as LIVE, ONLINE workshops accessible safely around the world.

Testing Instruments

Fatigue Property Mapping Testing Service

  • We added the Reliability Module to our Fatigue Property Mapping testing service. Use it to quantify crack precursor size statistics when you need to estimate probability of failure.
  • We also reorganized the Thermal Module and the Ageing Module into Basic and Advanced levels, to offer a lower price-point when a basic option will suffice.

Want to leverage any of these new capabilities in your next durability project?  Give us a call and let’s talk!

twitterlinkedinmail

Durability Insights from the ISA for Tire Tread Compound Development

My last blog post (Getting a Quick Read on Durability with the Intrinsic Strength Analyser) highlighted a one-hour test on the Intrinsic Strength Analyser (ISA) to screen elastomer materials for long-term fatigue performance, with applications in materials R&D and plant mixing quality control. To illustrate the use of this approach for rubber compound development, we recently had the opportunity to collaborate with Dr. Nihat Isitman from Goodyear Tire & Rubber Company in Akron, Ohio and Dr. Radek Stoček from Polymer Research Laboratory in Zlín, Czech Republic.1 Dr. Isitman led this project and was scheduled to present our research at the Spring 2020 Technical Meeting of the ACS Rubber Division, but the meeting was cancelled due to COVID-19 precautions. Instead, the Rubber Division is offering the content online, and the meeting presentations are available here for a modest fee.

Our study considered model tread compounds based on the well-known green tire formulation, which is a compatible blend of solution styrene-butadiene rubber (SBR) and high-cis butadiene rubber (BR) that is reinforced with a silica-silane system for low rolling resistance (improved fuel economy) passenger tires. Additional production compounds used in actual tire treads were also tested, but the proprietary results for these materials were not included in the public presentation. The SBR/BR ratio, silica loading, and crosslink density were all varied in this investigation. For each rubber formulation, the ISA was used to measure the fatigue threshold (T0) and critical tearing energy (tear strength; Tc), which bracket the two ends of the fatigue crack growth curve as shown below.

 Intrinsic strength and tear strength

The established cutting method of Lake and Yeoh2,3 is used for assessing T0 on the ISA, and the one-hour test on this benchtop instrument is concluded with a tearing procedure to measure Tc. The ISA is manufactured by Coesfeld GmbH & Co. in Dortmund, Germany, and distributed in the Americas by Endurica LLC (see photo).

The Intrinsic Strength Analyser manufactured by Coesfeld GmbH & Co. in Dortmund, Germany, and distributed in the Americas by Endurica LLC

The slide image below summarizes the key findings of this research collaboration. Optimization of T0 and Tc is possible thanks to different sensitivities to the various compounding variables. It is important to measure both fatigue threshold and tear strength to quantify durability potential of rubber materials, and the ISA is an efficient and effective instrument for these measurements. To learn more about this testing equipment for the rubber lab, please visit our Instruments page and contact us at info@endurica.com with questions.

 Summary of key findings of this research collaboration

References

  1. N. Isitman, R. Stoček, and C. G. Robertson, “Influences of compounding attributes on intrinsic strength and tearing behavior of model tread rubber compounds”, paper scheduled to be presented at the 197th Technical Meeting of the Rubber Division, ACS, Independence, OH, April 28-30, 2020 (online presentation due to meeting cancellation).
  2. G. J. Lake and O. H. Yeoh, “Measurement of Rubber Cutting Resistance in the Absence of Friction”, International Journal of Fracture 14, 509 (1978).
  3. C. G. Robertson, R. Stoček, C. Kipscholl, and W. V. Mars, “Characterizing the Intrinsic Strength (Fatigue Threshold) of Natural Rubber/Butadiene Rubber Blends”, Tire Sci. Technol. 47, 292 (2019).
twitterlinkedinmail

Getting a Quick Read on Durability with the Intrinsic Strength Analyser

There is now a one-hour test on a benchtop instrument for the rubber lab to screen materials for long-term fatigue performance. Please continue reading to learn more about this commercialization of a classical elastomer characterization methodology.

Rubber products manufacturers and raw materials suppliers seeking improved materials for next-generation applications depend on lab tests to predict end-use performance. These predictive tests should balance accuracy, relevance, and testing time. The testing time component is particularly challenging when the performance characteristic of interest is fatigue lifetime. The image of traditional fatigue testers chattering along for days or weeks comes to mind for those of us with experience in industrial rubber labs. The time consideration is the reason why tensile stress-strain testing (stretching a material to high strains until failure) is the most common physical test for the fracture behavior of rubber, in clear contrast to the most prevalent application condition for rubber products which is cyclic loading (fatigue) at much lower strains.

Fatigue crack growth is a key element of elastomer behavior that must be determined in order to predict durability, as illustrated below. For example, fatigue crack growth (FCG) testing provides the FCG rate law that is essential for predicting when and where cracks will show up in rubber products using Endurica’s elastomer fatigue software for finite element analysis [https://endurica.com/integrated-durability-solutions-for-elastomers/]. Endurica has developed a finitely scoped, reduced variability measurement approach1 which is used in our Fatigue Property Mapping testing services and is available on the Coesfeld Tear and Fatigue Analyser (TFA). Our standard FCG measurement protocol takes 20 hours of continuous testing. This testing time is very efficient for characterizing best candidate materials in the development process, but a faster test is needed for narrowing down, for example, 20 initial materials to 5 best candidates or for use in a plant lab to monitor quality of rubber compounding processes.

Key Components of Elastomer Fatigue and Failure

The Intrinsic Strength Analyser (ISA) is a recent addition to the durability testing solutions for elastomers. The ISA was developed through a partnership between Coesfeld GmbH & Co. (Dortmund, Germany) and Endurica LLC (Findlay, OH, USA), and this benchtop instrument employs a testing protocol based on the long-established cutting method of Lake and Yeoh.3,4 Endurica’s president, Dr. Will Mars, discusses the importance of measuring intrinsic strength (fatigue threshold) in this video on our YouTube channel which also shows some footage of the ISA in operation:

https://www.youtube.com/watch?v=BL92ppsJZfE

The fatigue crack growth curve of rubbery materials is bounded by the fatigue threshold, T0, on the low tearing energy (T) side and by the critical tearing energy (tear strength), Tc, at the high-T end. This is depicted in the generalized figure below. A streamlined one-hour procedure on the ISA can measure both T0 and Tc which can then be used to estimate the slope (F) of the intermediate FCG power law response that correlates well with the actual F from rigorous FCG testing using the TFA (see figure). More information about this quick ISA approach to characterizing rubber crack growth behavior for materials development and quality control can be found in the Annual Review 2019 issue of Tire Technology International (open access).2

ISA graph showing Crack Growth Rate compared to tearing energy

The fatigue crack growth slope

The fatigue crack growth slope, F, from the ISA should be considered an approximate value that is useful for comparing the relative FCG behavior of materials. However, the determination of T0 on the ISA is highly quantitative and the only realistic option for assessing this parameter, since the near-threshold crack growth testing on the TFA needed to define T0 would take about a month. The implementation areas for the ISA and TFA are compared in the following table. A very conservative approach to product development for elastomer durability is to create a combination of material behavior and component design that places the final operation of the rubber product below the fatigue threshold. If this is your company’s approach to engineering for durability, then the ISA is the testing instrument you need.

Durability Testing Solutions for the Rubber Lab

Crack precursor size is another key characteristic of elastomers that needs to be quantified in order to predict durability. In combination with a standard tensile stress-strain test, the critical tearing energy (Tc) from the ISA can also be used to assess crack precursor size, as we showed recently in an open access publication.5

Endurica is the exclusive Americas distributor of the Coesfeld ISA and TFA instruments. Endurica’s efficient and effective testing protocols are provided on these high-quality instruments for the rubber laboratory. To learn more about how to add these testing capabilities to your lab, please contact us at info@endurica.com.

References

  1. J. R. Goossens and W. V. Mars, “Finitely Scoped, High Reliability Fatigue Crack Growth Measurements”, Rubber Chem. Technol. 91, 644 (2018).
  2. C. G. Robertson, R. Stoček, R. Kipscholl, and W. V. Mars, “Characterizing Durability of Rubber for Tires”, Tire Technology International, Annual Review 2019, pp. 78-82.
  3. G. J. Lake and O. H. Yeoh, “Measurement of Rubber Cutting Resistance in the Absence of Friction”, International Journal of Fracture 14, 509 (1978).
  4. C. G. Robertson, R. Stoček, C. Kipscholl, and W. V. Mars, “Characterizing the Intrinsic Strength (Fatigue Threshold) of Natural Rubber/Butadiene Rubber Blends”, Tire Sci. Technol. 47, 292 (2019).
  5. C. G. Robertson, L. B. Tunnicliffe, L. Maciag, M. A. Bauman, K. Miller, C. R. Herd, and W. V. Mars, “Characterizing Distributions of Tensile Strength and Crack Precursor Size to Evaluate Filler Dispersion Effects and Reliability of Rubber”, Polymers 12, 203 (2020).
twitterlinkedinmail

Just Because You Can Doesn’t Mean You Should

Build it or Buy It | Endurica - Get Durability RightWhen you have an unmet simulation or testing need, should you build or buy the capability?

There are testing instruments and software packages available in the market – which have been improved through years of R&D and quality management – that can meet the needs of a technical team in their product development efforts. Despite these turn-key resources, we sometimes see a company tasking some of its engineers to build their own.

Why does this happen?

Companies hire smart and creative engineers and scientists with advanced degrees to populate their R&D centers. It is common, and even expected in many situations, for a graduate student to create customized equipment or software as a part of a Ph.D. or M.S. research project. Pushing the boundaries of science and technology often requires such development of devices or code. Also, limited research funding in academia can force students to build their own equipment. When young engineers start their industrial careers after graduate school, they carry with them the mindset of building and programming things themselves. These individuals excitedly offer to create when a new analysis or measurement need arises within a company, and managers like to encourage the enthusiasm of their technical staff.

But, even if your sharp engineer can build a DIY testing device or computer program that recreates the state-of-the-art commercial products created by teams of engineers across many years, is this an efficient and strategic use of the engineer’s abilities? If your company makes tires, for example, then shouldn’t you have your smart people focused on making better tires rather than making testing instruments or software?  What are the labor costs, and the opportunity costs, of your highly-skilled engineer building a piece of testing equipment compared to the price of the commercial instrument or relative to the return you could make on an actual improvement to your product? Unless you are in a position to surpass the commercial solution, there is no competitive advantage in the DIY solution. Once you have created your own solution, who will maintain and support it? Will you be able to keep it up to date with advances in technology? Do you have the capabilities and resources to validate your solution more strongly than the market has already validated the commercial solution?

Unless you are Anakin Skywalker, DIY is not always a winning strategy

Through my 15 years of experience in materials research and development in the tire and rubber industry, I have seen several pieces of home-built testing equipment collecting dust within companies. Either they were half finished and abandoned or could only be reliably operated by the creator who moved to another department or company.

There can be circumstances where the needed instrument or simulation product is not commercially available. Sometimes the capability exists in the marketplace, but it is not discovered because the maker mindset leads to a halfhearted search. For customized solutions, you may consider working with a vendor to leverage their expertise in creating the required device or program.

If your analysis and testing needs are in the rubber fatigue and lifetime area, please talk to us before you decide to invest in creating your own solutions. Our solutions embody decades of experience. They are the most competitive and strongly validated solutions you can buy. Endurica has specialized finite element analysis software that predicts elastomer durability for complex geometries and loads, and we offer testing instruments for accurately characterizing the fracture mechanics of elastomers through our partnership with Coesfeld GmbH & Co. KG. We can take you quickly to the forefront of fatigue management capabilities.


twitterlinkedinmail

Integrated Durability Solutions for Elastomers

Will the durability of your new rubber product meet the expectations of your customers? 

Do you have a comprehensive capability that fully integrates all of the disciplines required to efficiently achieve a targeted durability spec?

Your engineers use finite element analysis (FEA) to model the elastomer component in the complex geometry and loading cycle for the desired product application.  One traditional approach to predicting durability is to develop a rough estimate of lifetime by looking at maximum principal strain or stress in relation to strain-life or stress-life fatigue curves obtained for the material using lab specimens in simple tension.  The difficulties and uncertainties with this method were discussed in a recent blog post.

a rough estimate of lifetime by looking at maximum principal strain or stress in relation to strain-life or stress-life fatigue curves obtained for the material using lab specimens in simple tension


A modern approach to elastomer durability is to use the Endurica CL™ durability solver for FEA.  This software uses rubber fracture mechanics principles and critical plane analysis to calculate the fatigue lifetime – which is the number of times the complex deformation cycle can be repeated before failure – for every element of the model.  This provides engineers with the ability to view lifetime throughout the FEA mesh, allowing them to modify design features or make material changes as needed to resolve short-lifetime areas.

view lifetime throughout the FEA mesh, allowing them to modify design features or make material changes as needed to resolve short-lifetime areas.

A sound finite element model of the elastomer product in the specified loading situation and fundamental fatigue material parameters from our Fatigue Property Mapping™ testing methods are the two essential inputs to the Endurica CL software.  This is illustrated in the figure below.

A sound finite element model of the elastomer product in the specified loading situation and fundamental fatigue material parameters from our Fatigue Property Mapping™ testing methods are the two essential inputs to the Endurica CL software.

The requisite elastomer characterization methods can be conducted by us through our testing services or by you in your laboratory with our testing instruments.  For some companies, consulting projects are a route to taking advantage of the software before deciding to license the unique predictive capabilities.  The following diagram shows how our products and services are integrated.

Durability Solutions for Elastomers

For companies that are just getting started with implementing our durability solutions, the following is a typical testing services and consulting project:

  1. We use our Fatigue Property Mapping™ testing methods, through our collaboration with Axel Products Physical Testing Services, to characterize the properties of cured sheets of rubber compounds sent to us by the client. The minimum requirements for fatigue modeling are crack precursor size and crack growth rate law, and these are quantified within our Core Fatigue Module.  Special effects like strain-induced crystallization and aging/degradation are accounted for using other testing modules when applicable.
  2. The client sends us the output files from their finite element analysis (FEA) of their elastomer part design for the deformation of their complex loading cycle. It is common for the goal to be a comparison of either two designs, two distinct loading profiles, two different rubber compounds, or combinations of these variations.  Our software is fully compatible with Abaqus™, ANSYS™, and MSC Marc™, so the simulations can be conducted on any of these FEA platforms.  In some situations where a client does not have their own FEA capabilities, one of Endurica’s engineers will set up the models and perform the analyses instead.
  3. The fatigue parameters and FEA model are inputted to Endurica CL fatigue solver to calculate values of the fatigue lifetime for every element of the model. The lifetime results are then mapped back onto the finite element mesh in Abaqus, ANSYS, or MSC Marc so that the problem areas (short lifetime regions) within the geometry can be highlighted.
  4. We review the results with the client and discuss any opportunities for improving the fatigue performance through design and material changes.

Advanced implementors of our durability solutions have licensed the Endurica CL software and are using our rubber characterization methods in their laboratories on a routine basis, with instruments provided through our partnership with Coesfeld GmbH & Co. (Germany).  One recently publicized example of a company using the Endurica approach to a very high degree is Tenneco Inc., which you can read about here.

We want to help you #GetDurabilityRight, so please contact us at info@endurica.com if you would like to know more about how Endurica’s modern integrated durability solutions for elastomers can help enable a product development path that is faster, less expensive, and more confident.

twitterlinkedinmail

Strain-Induced Crystallization in High Cis Butadiene Rubber: Fact or Fiction?

There is an ongoing drive to create synthetic rubber that can give mechanical performance matching the properties of natural rubber (NR) – excellent strength, tear resistance, and fatigue crack growth resistance – which are attributed to the ability of NR to strain crystallize.  I have attended several technical conferences in the tire and rubber field where I have witnessed presentations about new grades of polybutadiene (butadiene rubber (BR)) with high cis-1,4 structure, wherein a claim is made about the improved ability of the BR to undergo strain-induced crystallization (SIC) for better mechanical properties in tires and other rubber applications.  Similar statements can be found in technical marketing materials and in patents.1,2  To what extent is this true?  This post takes a closer look at this topic.

It is first useful to show why strain-induced crystallization is key to the unique mechanical properties of natural rubber.  One of the most conclusive studies on the function of strain-induced crystals to slow the growth of cracks in cyclic fatigue is the work by Brüning et al.3  The movie below from this research shows an edge crack region in NR reinforced with 40 phr of N234 carbon black that is experiencing cyclic deformation from 0% to 70% planar tension at a frequency of 1 Hz.  Each pixel at each time in the video represents a wide-angle X-ray diffraction pattern collected in real time while stretching in a synchrotron X-ray beam, with red color used to indicate crystallinity and black for purely amorphous regions.  You can see the crystals form during stretching which self-reinforces the rubber at the crack tip region to resist further growth of the crack.  These experiments are very revealing, but they are extremely difficult and expensive to perform, as they require scattering analysis expertise, specially designed stretching devices with precise spatial control, and access to one of the few national laboratory sites where synchrotron X-ray studies can be performed.

Stereoregular polymers can crystallize in a window bounded by the glass transition temperature (Tg) and the melting temperature (Tm). When stretched, a polymer can crystallize at temperatures above its normal melting temperature due to melting temperature elevation caused by the well-known chain orientation/entropy effect.4  Chain orientation results in an increase in melting temperature from Tm to Tm,SIC.  This is shown schematically in the figure below for NR and BR.  The Tg and Tm for BR are significantly lower than the values for NR.  Therefore, even after perfecting the structure of polybutadiene to achieve >98% cis-1,4 structure though catalyst and process innovations, BR still has an intrinsic disadvantage compared to NR when it comes to SIC in the common temperature range where durable rubber components are employed.


Gent and Zhang5 recognized the lower Tm,SIC for BR compared to NR for samples crystallized in uniaxially strained conditions.  Ultra high cis BR with 98% cis content did not show any evidence of strain-induced crystallization at 23 °C whereas NR clearly exhibited SIC in a study by Kang and coworkers.6  In an investigation by Toki et al.,7 it was necessary to reduce the temperature to 0°C before high cis BR showed a crystalline X-ray scattering pattern at a strain of 5 (500% elongation).

As an aside, I will caution the use of the entropy-driven melting temperature increase as the only explanation for strain-induced crystallization above the normal Tm.  Natural rubber is quite a slow crystallizing polymer in the unstretched state, even when annealed in the prime crystallization regime midway between Tg and Tm.  In stark contrast, strain-induced crystallization occurs very fast in NR which highlights the complexity of behavior beyond the over-simplification given in the figure above.

So, why is there not more focus on synthetic high cis-1,4-polyisoprene which has the same polymer microstructure and strain crystallization window as NR?  The short answer is that the butadiene monomer is much more commercially available than isoprene at many synthetic rubber plants around the world.  I remember the early years in my industrial R&D career when I was working with some very talented polymer chemists at Bridgestone / Firestone.   I was developing new molecular architectures for improved synthetic rubber to use in various tire compounds.  The chemists told me that they could make almost any polymer design I wanted, as long as it could be made from styrene and/or butadiene.  This restriction reflected the fact that these two monomers were the commonly available feedstocks at the commercial plants where the polymers would eventually be produced.

In closing, it is a fact that high cis polybutadiene can strain crystallize at sub-ambient temperatures, but it is fiction that it will strain crystallize in the same manner as natural rubber at room temperature and above.

Do you want to see if your rubber will really exhibit strain-induced crystallization in a practical way that is relevant to end-use applications?  Contact me (via email: cgrobertson@endurica.com) to learn more about the Non-Relaxing Module in Endurica’s portfolio of testing services that was specifically developed to efficiently highlight SIC effects.8-10

References

1 http://arlanxeo.de/uploads/tx_lxsmatrix/sustainable_mobility_01.pdf

2  S. Luo, K. McKauley, and J. T. Poulton, “Bulk polymerization process for producing polydienes”, U.S. Patent 8,188,201, granted May 29, 2012 to Bridgestone Corporation.

3 K. Brüning, K. Schneider, S. V. Roth, and G. Heinrich, “Strain-induced crystallization around a crack tip in natural rubber under dynamic load”, Polymer 54, 6200 (2013).; movie provided to Endurica LLC by the authors (movie to be used only with permission from Karsten Brüning).

4 P. J. Flory, “Thermodynamics of crystallization in high polymers. I. Crystallization induced by stretching”, Journal of Chemical Physics 15, 397 (1947).

5 A. N. Gent and L.-Q. Zhang, “Strain-induced crystallization and strength of elastomers. I. cis-1,4-polybutadiene”, Journal of Polymer Science Part B: Polymer Physics 39, 811 (2001)

6 M. K. Kang, H.-J. Jeon, H. H. Song, and G. Kwag, Strain-induced crystallization of blends of natural rubber and ultra high cis polybutadiene as studied by synchrotron X-ray diffraction”, Macromolecular Research 24, 31 (2016).

7 S. Toki, I. Sics, B. S. Hsiao, S. Murakami, M. Tosaka, S. Poompradub, S. Kohjiya, and Y. Ikeda, “Structural developments in synthetic rubbers during uniaxial deformation by in situ synchrotron X-ray diffraction”, Journal of Polymer Science Part B: Polymer Physics 42, 956 (2004).

8 K. Barbash and W. V. Mars, “Critical Plane Analysis of Rubber Bushing Durability under Road Loads”, SAE Technical Paper 2016-01-0393, 2016, https://doi.org/10.4271/2016-01-0393.

9 W. V. Mars and A. Fatemi. “A phenomenological model for the effect of R ratio on fatigue of strain crystallizing rubbers”, Rubber Chemistry and Technology 76, 1241 (2003).

10 https://endurica.com/specifying-strain-crystallization-effects-for-fatigue-analysis/


twitterlinkedinmail
close
Trial License RequestTrial License RequestTrial License RequestTrial License RequestTrial License Request

Our website uses cookies. By agreeing, you accept the use of cookies in accordance with our cookie policy.  Continued use of our website automatically accepts our terms. Privacy Center