Rubber Fatigue ≠ Metal Fatigue Part 1: Mean Strain Effects

Rubber Fatigue does not equal Metal Fatigue Part 1 Mean Strain Effects
Figure 1. Constant amplitude cycles at three different mean strains.

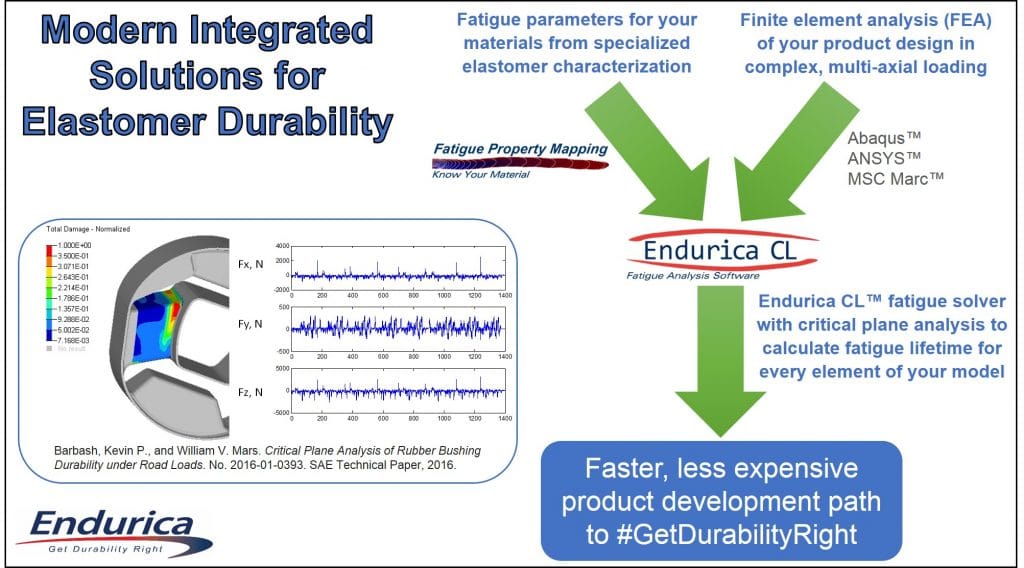
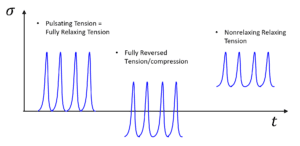
Rubber and metal are very different materials that exhibit very different behaviors.  Consider the effect of mean strain or stress on the fatigue performance of these materials.  Figure 1 illustrates a few typical constant amplitude strain cycles, each at a different level of mean strain.  If the stress amplitude is equal to the mean stress, we say that we have pulsating tension or fully relaxing tension.  If the mean stress is zero, we say that we have fully reversed tension/compression.  If the minimum stress is always positive, then we have nonrelaxing tension (i.e. always under load).  Nonrelaxing cycles are quite common in applications.  Examples include: pre-loads applied during installation; swaging of a bushing to induce compressive pre-stresses, interference fits, self-stresses occurring due to thermal expansion/contraction; and in tires, shape-memory effects of textile cords.

In metal fatigue analysis, it is customary to define the effect in terms of stress amplitude σa and mean stress σm, relative to the yield stress σy and the ultimate stress σu, as shown in Figure 2.  Below the fatigue threshold stress σ0, indefinite life is predicted. The Haigh (or Goodman)

Figure 2. Haigh diagram (left) and Wohler curves (right) showing mean strain effects on fatigue life for a metal.

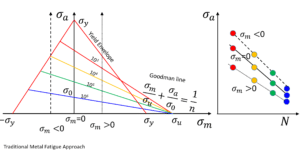
diagram (left) maps fatigue life as a function of these parameters [1]. Wohler curves (right) provide similar information.  For metals, a simple rule may be applied universally: increasing mean strain is detrimental fatigue life.  It is also commonly assumed for metals that the critical plane is perpendicular to maximum principal stress direction.

There are many ways that rubber materials differ from metallic materials.  At the atomic scale, rubber is composed of long chain molecules experiencing constant thermal motion while interlinked with a permanent network topology.  This structure permits large, elastic/reversible straining to occur.  Metals could not be more different, existing as individual atoms packed into well-ordered crystals with occasional dislocations or lattice vacancies.  This structure permits only vanishingly small strains before inelastic deformation occurs.  At the meso scale, rubber is typically a composite material containing fillers such as carbon black, silica or clay, as well as other chemical agents.  The mesoscale of a metal is generally described in terms of crystalline grain boundaries and inclusions or voids.  Rubber exhibits many “special effects” that are not seen in metals: rate and temperature dependence, ageing, cyclic softening.  It is unsurprising that analysis methods for rubber differ substantially from those applied for metals.

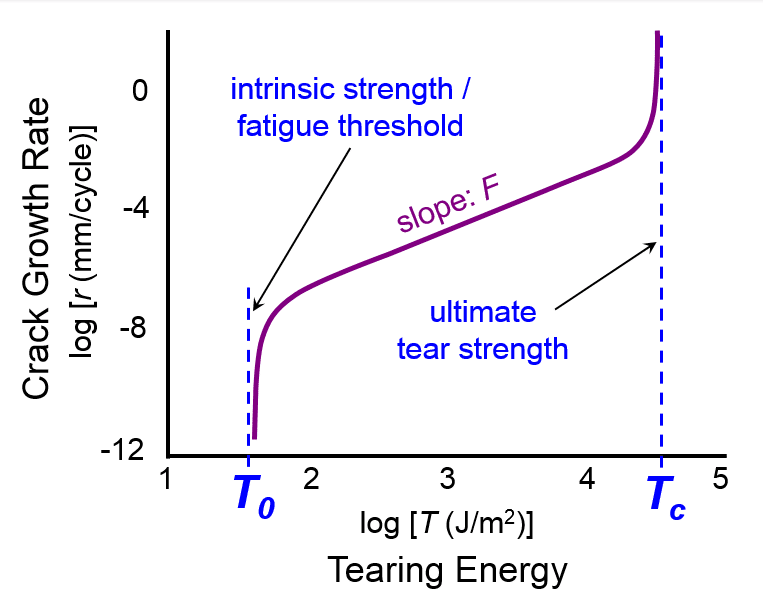
Rubber’s fatigue performance has a more complex dependence on mean strain. For amorphous (ie non-crystallizing) rubbers, increasing mean strain reduces the fatigue life, as with metals.  But for rubbers that exhibit strain-induced crystallization, mean strain can greatly increase fatigue life, as illustrated in Figure 3.  Fatigue simulations therefore must take account of the strain crystallization effect.

Figure 3. Fatigue tests run in simple tension under constant amplitude show a significant increase in life for Natural Rubber (NR), which strain crystallizes, and a decrease of life for Styrene Butadiene Rubber (SBR) which is amorphous [2].
Mean strain effects are specified in the Endurica fatigue code in terms of fracture mechanical behavior, using the concept of an equivalent fully relaxing tearing energy Teq.  The tearing energy for fully relaxing conditions is said to be equivalent when it produces the same rate of crack growth as the nonrelaxing condition.  For amorphous rubbers, the equivalent R=0 tearing energy Teq is simply the range ΔT of the tearing energy cycle, which can be expressed in terms of the min and max tearing energies Tmin and Tmax, or in terms of R= Tmin / Tmax.  Plugging this rule into the power law crack growth rate function yields the well known Paris law, which predicts faster crack growth for increasing mean strain.  For a strain crystallizing rubber, the equivalent fully relaxing tearing energy can be specified using the Mars-Fatemi law.  In this case, the equivalent fully relaxing tearing energy depends on a function F(R), which specifies the crystallization effect in terms of its influence on the powerlaw slope of the crack growth rate law.  The relationship for amorphous and crystallizing rubbers are summarized in Table 1 [3,4].

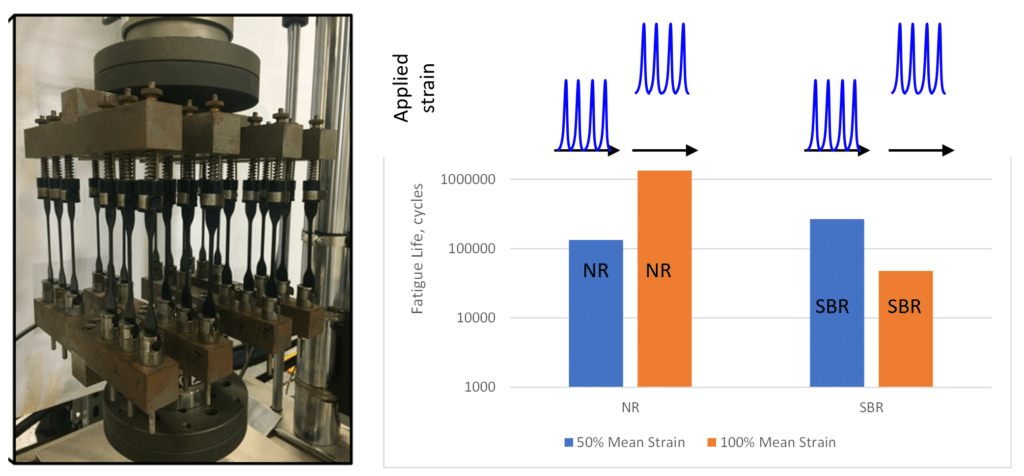
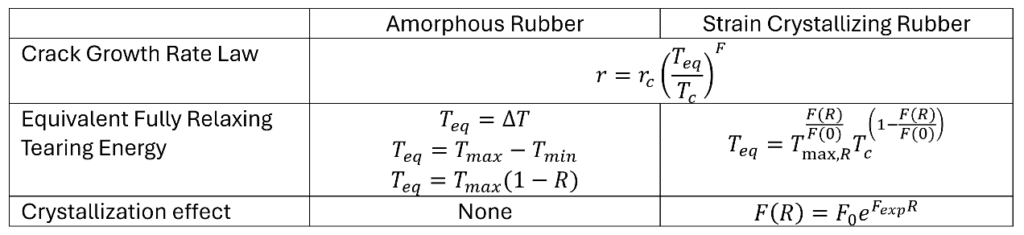
Table 1.  Models for computing crack growth rate in amorphous and strain-crystallizing rubbers.

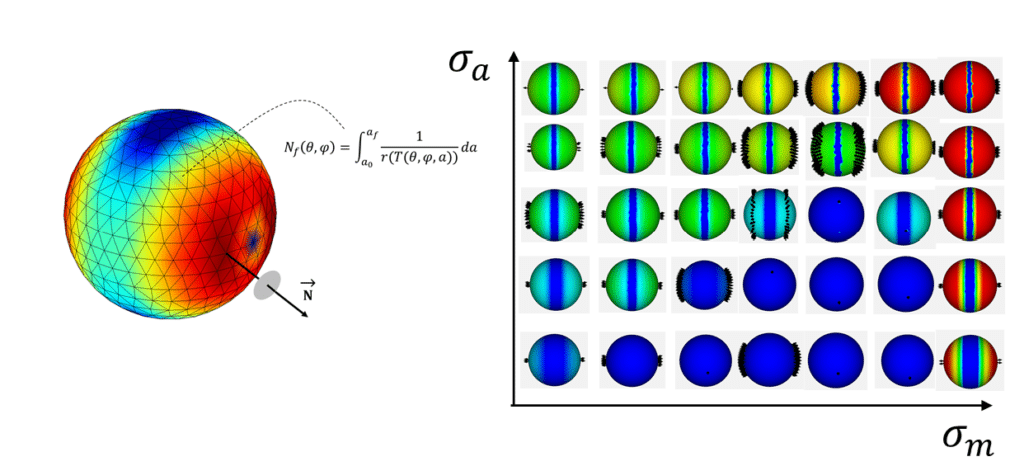
Rubber’s fatigue behavior may be plotted in a Haigh diagram, but the contours can be quite different than for metals.  In metal fatigue analysis, it is assumed that cracks always develop perpendicular to the max principal stress direction. This is not always true for rubber, especially in cases involving strain crystallization and nonrelaxing loads.  For rubber fatigue analysis it is therefore required to use critical plane analysis [5], in which fatigue life is computed for many potential crack orientations, and in which the crack plane with the shortest life is identified as the most critical plane.  Figure 4 shows the dependence of the fatigue life and the critical plane orientation on strain amplitude and mean strain.  A sphere is plotted for each pair of strain amplitude and mean strain coordinates, on which the colors represent fatigue life, and unit normal vectors indicate critical plane orientations.  It can be seen that different combinations of mean strain and strain amplitude can produce a range of crack plane orientations.

Figure 4. Critical plane analysis consists in integrating the crack growth rate law for every possible crack orientation, and identifying the orientation that produces the shortest life (left). Each point in the Haigh diagram (right) is associated with its own critical plane orientation.

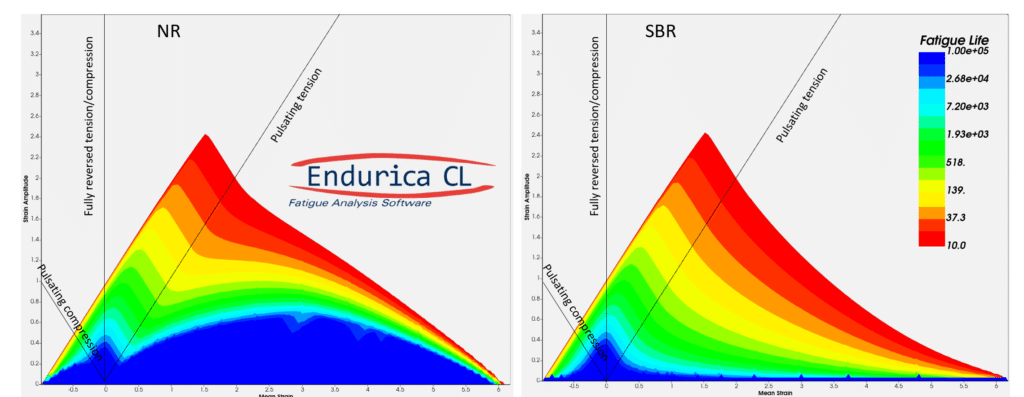
The Haigh diagrams for natural rubber (NR) and for styrene butadiene rubber (SBR) are shown in Figure 5.  In these images, red represents short fatigue life, and blue long life.  For natural rubber (on the left), the long-life region of the Haigh diagram exhibits a notable dome-like shape, indicative of a beneficial effect of mean strain under the influence of strain-induced crystallization. In contrast, SBR always exhibits decreased fatigue life as mean strain increases.  Even so, the Haigh diagram for SBR has a nonlinear character associated with the material’s hyperelasticity that is also distinct from a metal.

Figure 5. Haigh diagrams computed for NR (left) and for SBR (right) rubbers.

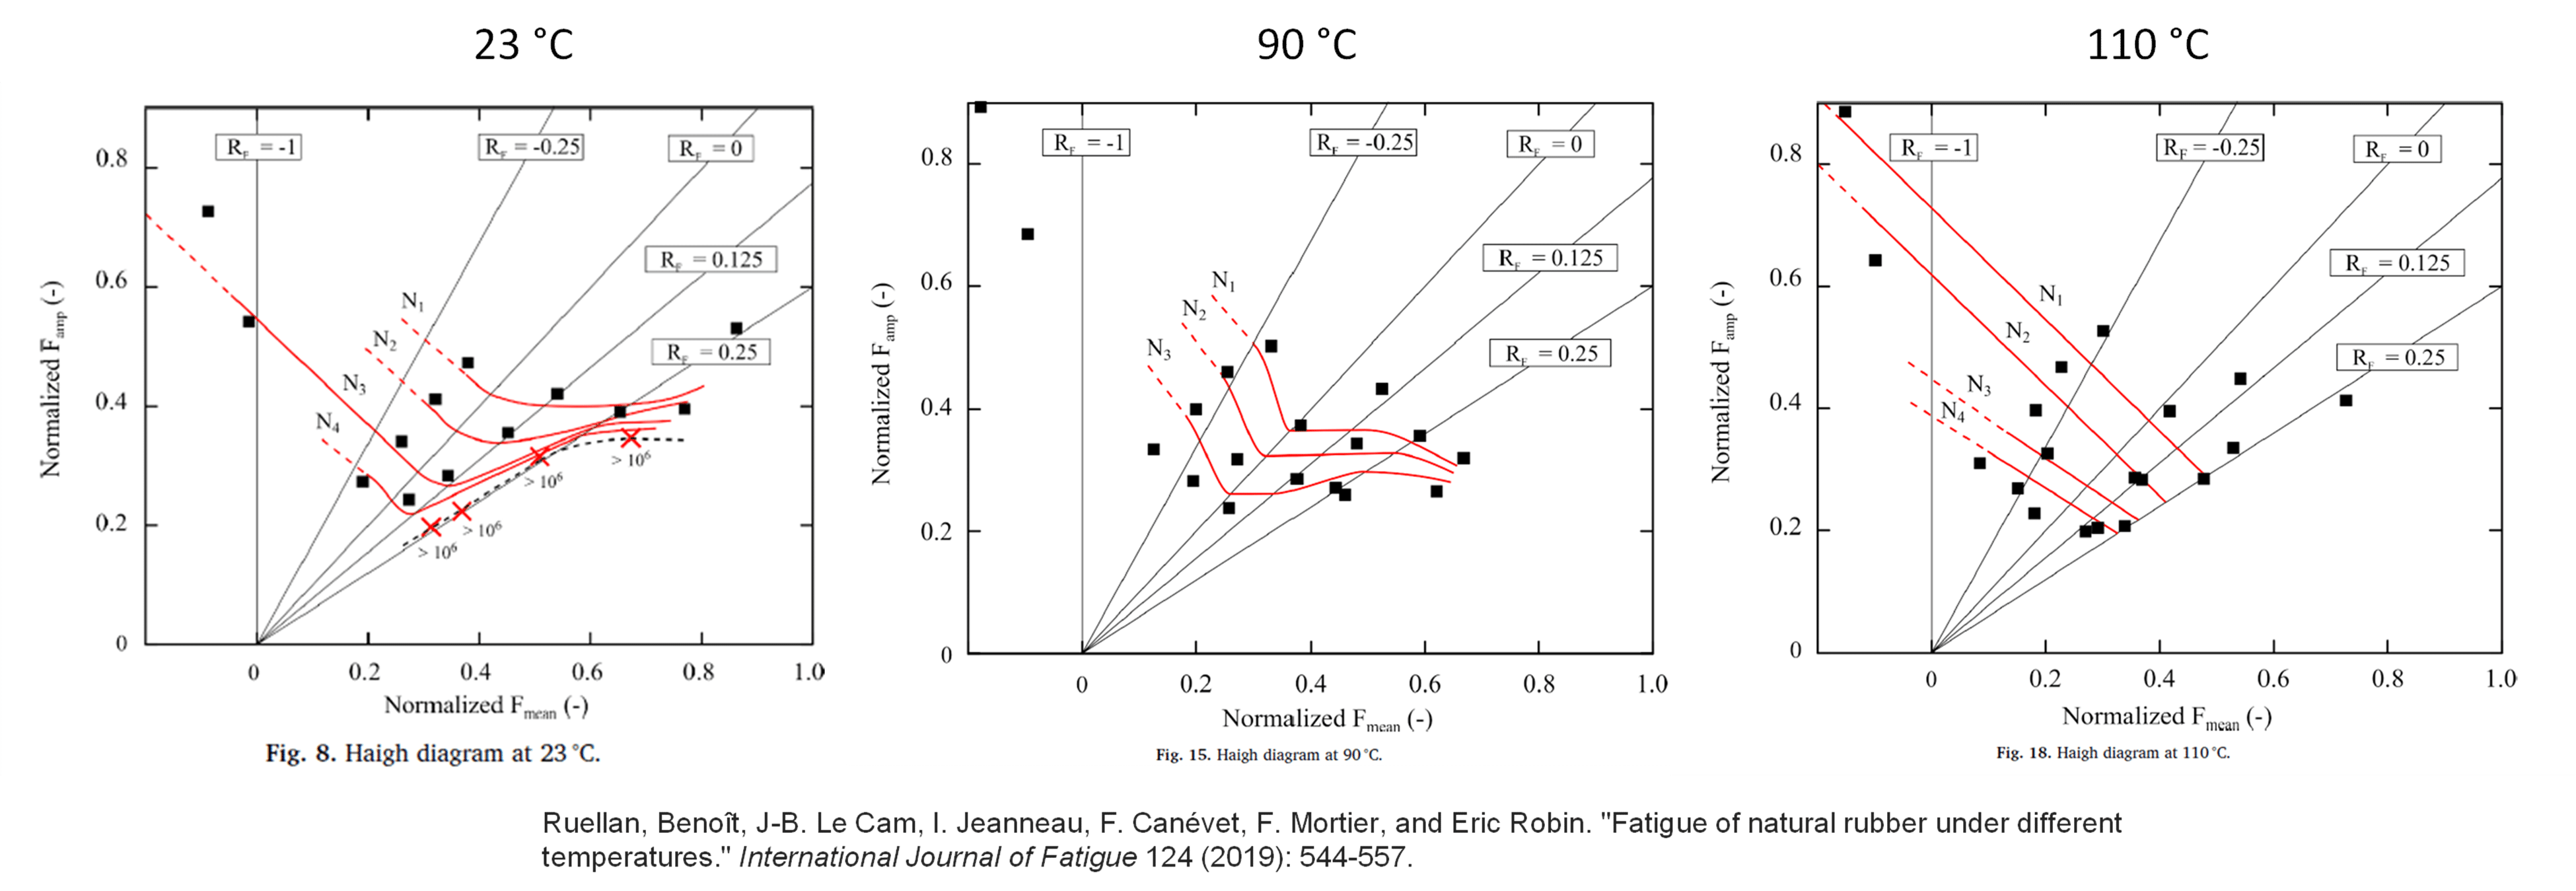
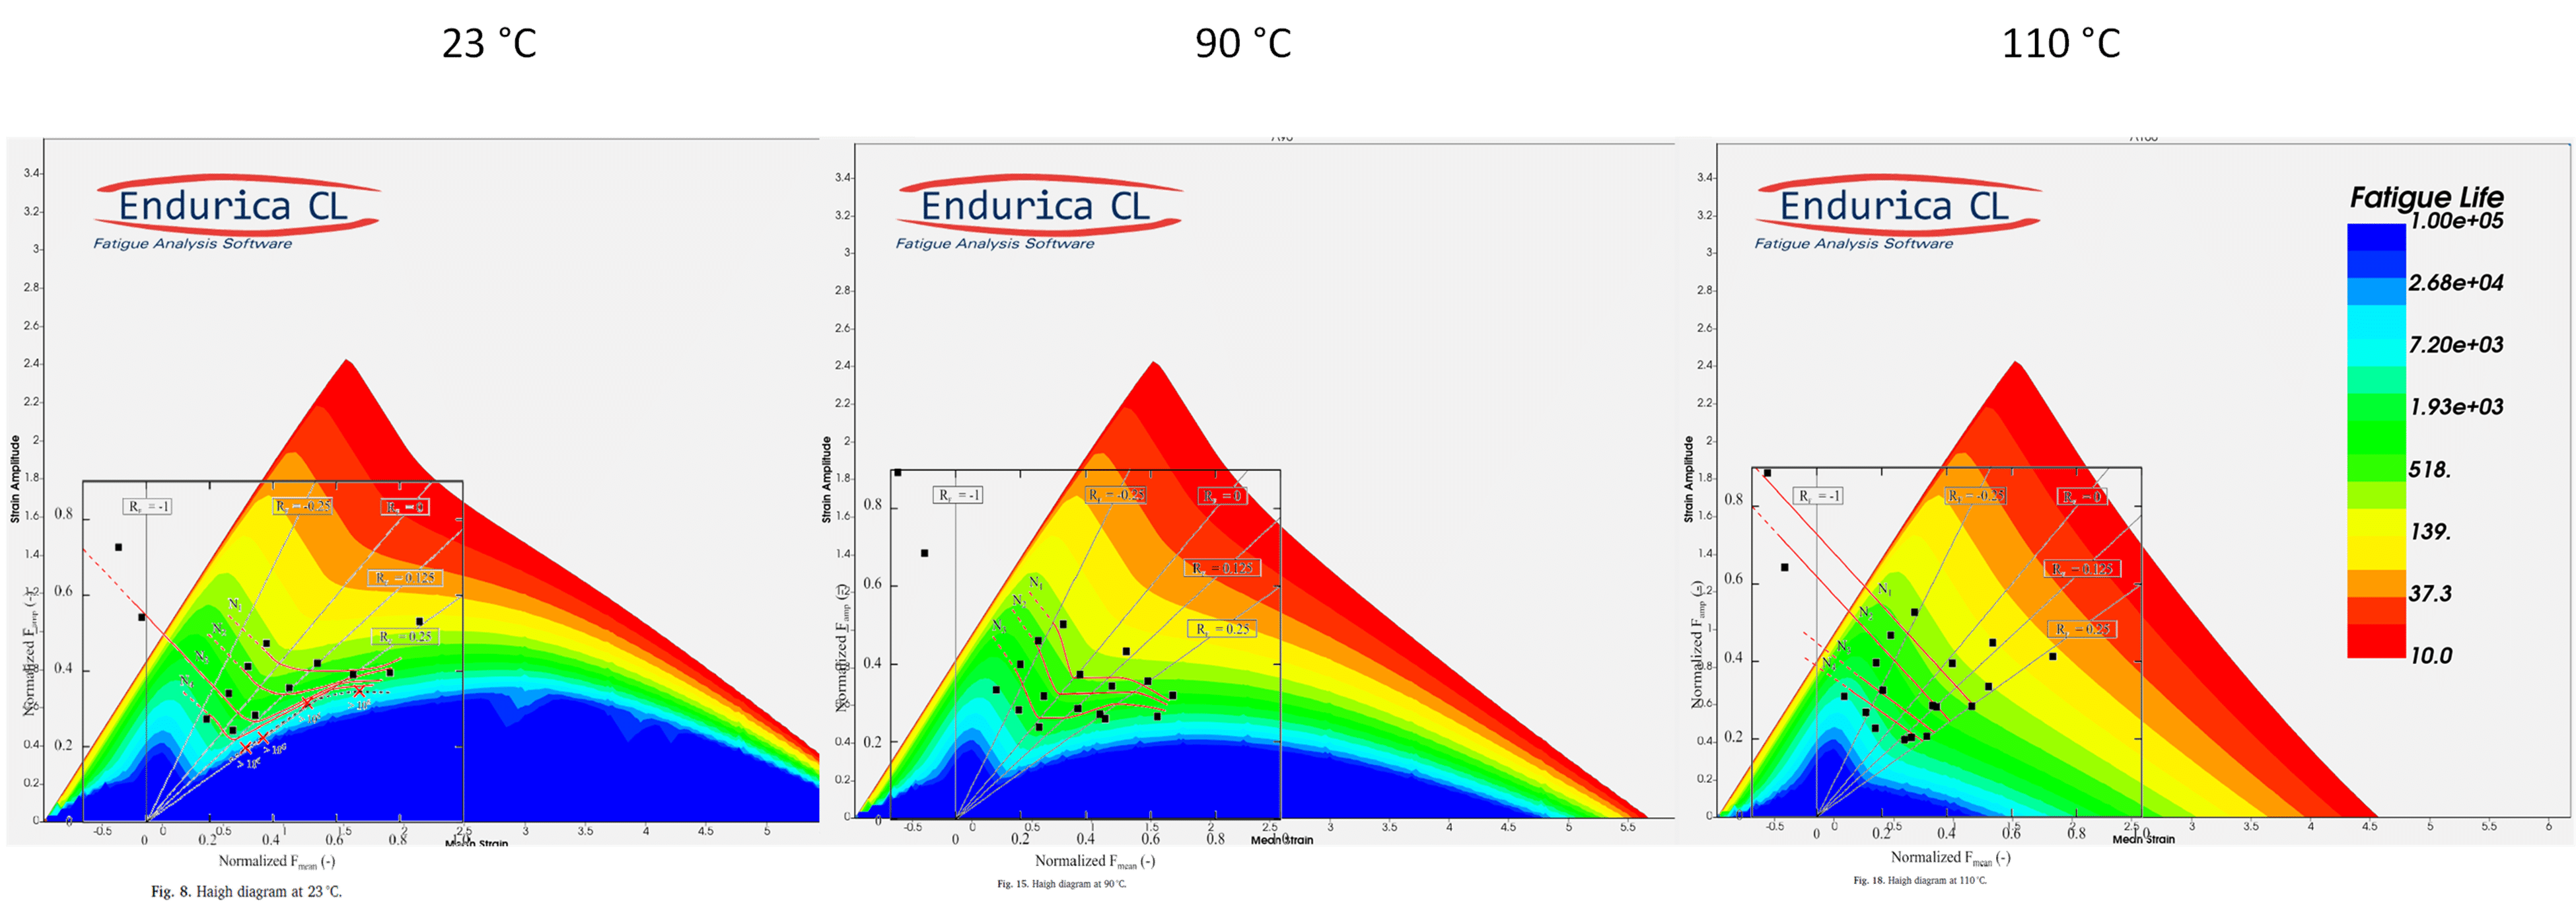
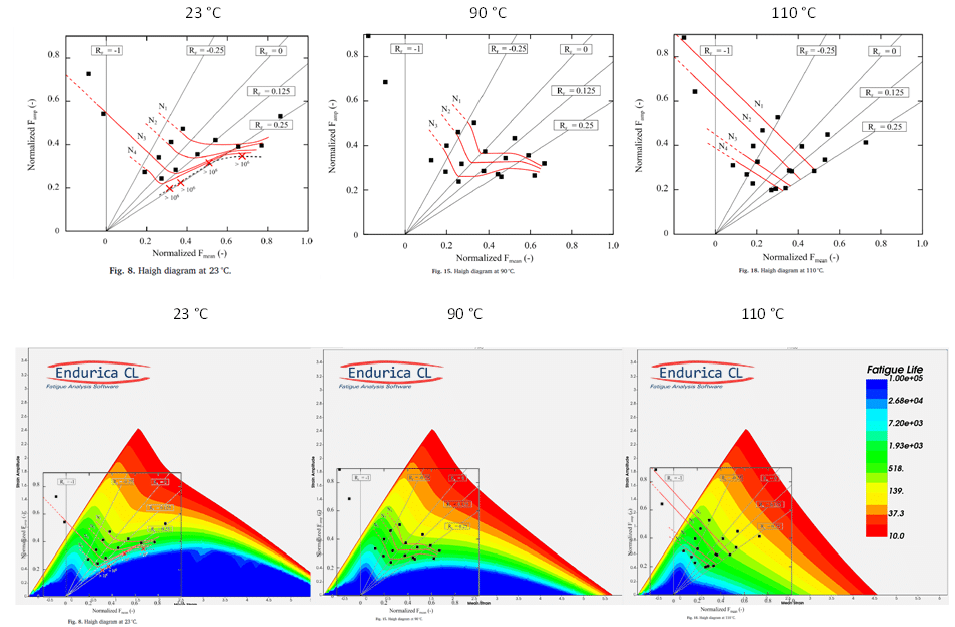
It should be noted that the strain crystallization effect in rubber depends on temperature.  At colder temperatures, the effect is stronger, and at higher temperatures it is weaker.  Figure 6 compares experimental Haigh diagrams [6] (top) for a crystallizing rubber to computed results (bottom) for three temperatures.

Figure 6. Experimental Haigh diagram [6] for natural rubber at 3 temperatures (top), compared to computed Haigh diagram (bottom). Increasing temperature tends to reduce the beneficial effect of strain crystallization.
In summary, while tensile mean stresses are always detrimental in metals, in rubber they may be either beneficial or harmful, depending on whether the rubber can strain crystallize. The benefits of mean stresses in rubber can be quite strong – sometimes amounting to more than several orders of magnitude. The beneficial effect is stronger at colder temperatures and is reduced at higher temperatures.  Critical Plane Analysis is essential for accurately predicting the effects of strain crystallization in rubber.  Wohler curves, commonly used for metal fatigue analysis, incorrectly assume that the worst-case plane is always normal to the max principal stress direction.  This is not an accurate approach for strain crystallizing rubber under mean strain.  Use the Endurica fatigue solvers to accurately capture these effects when its important to get durability right!

References

[1] Stephens, R. I., Fatemi, A., Stephens, R. R., & Fuchs, H. O. (2000). Metal fatigue in engineering. John Wiley & Sons.

[2] Ramachandran, Anantharaman, Ross P. Wietharn, Sunil I. Mathew, W. V. Mars, and M. A. Bauman.  (2017) “Critical plane selection under nonrelaxing simple tension with strain crystallization.” In Fall 192nd technical meeting of the ACS Rubber Division, pp. 10-12.

[3] Mars, W. V. (2009). Computed dependence of rubber’s fatigue behavior on strain crystallization. Rubber Chemistry and Technology82(1), 51-61.

[4] Harbour, Ryan J., Ali Fatemi, and Will V. Mars. “Fatigue crack growth of filled rubber under constant and variable amplitude loading conditions.” Fatigue & Fracture of Engineering Materials & Structures 30, no. 7 (2007): 640-652.

[5] Mars, W. V. (2021). Critical Plane Analysis of Rubber. Fatigue Crack Growth in Rubber Materials: Experiments and Modelling, 85-107.

[6] Ruellan, Benoît, J-B. Le Cam, I. Jeanneau, F. Canévet, F. Mortier, and Eric Robin. “Fatigue of natural rubber under different temperatures.” International Journal of Fatigue 124 (2019): 544-557.


twitterlinkedinmail

2023 – a Year of Magnitude and Direction

2023 marked year 15 for Endurica.  If I had to pick one word to describe the past year, that word would be “vector”.  Because magnitude and direction.  😊

We updated our core value statement this year.  The first one I ever wrote as part of Endurica’s original business plan listed 3 values: technical leadership, customer focus, and trustworthiness.  Those values served us well for many years and in many ways shaped who we have become.  But it was important this year to take stock again.  We’ve grown 8-fold since I wrote those down!  So our team spent many hours revisiting our shared values and deliberating over which will best define our culture and steer us right going forward.  In the end, we decided to keep the first 3, and we added 3 more:  embrace the grit, make an impact, and better every day.

We also completed an exercise to articulate what makes Endurica truly unique in the CAE / durability simulation space.  The 3 words we chose are… Accurate, Complete, and Scalable.

  • Accurate refers to the accurate material models that capture rubber’s many “special effects”, the accurate critical plane analysis method for analyzing multiaxial history, the accurate handling of nonlinear relationships between global input load channels and local crack experiences, and the extensive set of validation cases that have demonstrated our accuracy over the years. Nobody offers a more accurate solution for rubber durability.
  • Complete refers to our complete coverage of infinite life, safe life and damage tolerant approaches to testing and simulation. It refers to feature completeness that enables users to account for nearly any material behavior under nearly any service conditions.  Finally, it refers to the documentation, the materials database, and the examples we distribute with the software and with our webinar series.  Nobody offers a more complete solution for rubber durability.
  • Scalable refers to our capacity to apply our solutions efficiently in all circumstances. Scalability is the training we provide so that users can learn our tools quickly.  Scalability is access to powerful, ready-to-use workflows right when you need them.  Scalability is the modular approach we take to material testing and modeling so that simple problems can be solved cheaply and complex problems can be solved accurately in the same framework.  Scalability is our multi-threading that allows job execution time to be accelerated to complete impactful analysis on tough deadlines.  Nobody offers a more scalable solution for rubber durability.

2023 was not all navel-gazing and new marketing.  We also had magnitude and direction in other areas.

Top 10 Code Developments:

  1. New Endurica Architecture: After several years of development and a soft launch under the Katana project name, we finally completed our migration to the new architecture.  The new architecture provides a huge speed advantage for single thread and now for multithread execution. It uses a new input file format (.json). The json format makes it easier than ever for users to build customized and automated workflows via Python scripting.
  2. Sequence Effects: Sometimes the order of events matters to durability, and sometimes it doesn’t. We introduced Steps and Blocks to our input file, giving users complete control over the specification of multi-block, multi-step scheduling of load cases.  There is also a new output request that came out of this work: residual strength.
  3. EIE: 6 channels and support for RPC: Support for 6 channels of load input was one of our most highly requested new features.  Fast growing use of this feature led to further enhancements of the workflow (support for rpc file format, studies of map building techniques), and new recommendations on how to implement boundary conditions for specified rotation histories in explicit and implicit finite element models.
  4. Queuing: Design optimization studies need efficient management and execution of multiple jobs. Endurica’s software license manager now supports queueing for licenses. Queuing allows a submitted job to automatically wait to start until a license is available, instead of the prior behavior of exiting with a license error. Now you can submit many jobs without worrying about license availability.
  5. Haigh Diagram Improvements: We implemented an improved discretization of the Haigh diagram, and parallelized its evaluation. Now you get much nicer looking results in a fraction of the time. For details, check out our blog post on Haigh diagrams and also read about other improvements like axis limit setting and smoother contour plots.
  6. Viewer image copy: There is now a button! Its easier than ever to get your images into reports.
  7. Documentation Updates: We have been focusing on improving documentation this year. There are many new sections in the theory manual and user guide, as well as a getting started guide and more examples.  Stay tuned for many more examples coming in 2024!
  8. User Defined Planes: It is now possible to define your own set of planes for the critical plane search. One example where you might want to do this would be the situation where you would like to refine the critical plane search on a limited domain of the life sphere.
  9. New Database Materials: We added 7 new carbon black and silica filled EPDM compounds to the database. We are now up to 42 unique rubber compounds in the database.
  10. Uhyper Support: The new architecture now supports user-defined hyperelasticity. If you have a Uhyper subroutine for your finite element analysis, you can use it directly with Endurica.


Testing Hardware

We completed the acquisition and installation at ACE labs of a Coesfeld Instrumented Cut and Chip Analyser (ICCA).  The ICCA provides unmatched measurement and control of impact conditions, and provides a way to evaluate rubber compounds for their resistance to cutting and chipping.


Applications, Case Studies, Webinars

Never underestimate the students! We were blown away by the work of undergraduates at the University of Calgary with our tools and Ansys.  The students designed an airless tire, completing durability simulations using Endurica software within the scope of a senior design project. They were able to Get Durability Right on a short timeline and a student budget. Check out their multi-objective, high-performance design project here.

Analyzing what happens to tires as they take on the most celebrated testing track in the world might have been the funnest project Endurica’s engineers tackled in 2023. We presented the technical details at The Tire Society annual meeting and more in a followup webinar. An extensive Q&A session followed, and I loved the final question: “So, how long before we have a dashboard display of ‘miles to tire failure’ in our cars?”  Bring it.  We are ready!

Our Winning on Durability webinar series hit a nerve with the Metal Fatigue DOES NOT EQUAL Rubber Fatigue episodes on mean strain (the tendency of larger mean strains to significantly INCREASE the fatigue life of some rubbers!) and linear superposition (for converting applied load inputs to corresponding stress/strain responses). The great response has lead to our third installment on the differences between rubber and metal fatigue with an upcoming presentation on temperature effects.

twitterlinkedinmail

Defining the Temperature Dependence of Strain Crystallization in Endurica

Crystallization requires the suppression of molecular mobility, which in natural rubber can happen either by reducing the temperature or by increasing the strain.  Crystallization of natural rubber can be extremely beneficial to durability.  Nonrelaxing conditions (ie R>0) can increase life by factors of more than 100!  So, what happens if you have both high mean strain and high temperature?

This was the question studied in 2019 by Ruellan et al.  They constructed Haigh diagrams for a filled natural rubber at 3 temperatures: 23 degC, 90 degC and 110 degC.  They completed a large experimental study using dumbbell shaped specimens with a matrix consisting of approximately 4 R ratios x 4 amplitudes x 3 temperatures = 48 conditions.  Their results show that the increase of fatigue life with increasing mean strain at constant amplitude disappears as temperature is increased.  In particular, notice how at 23 degC each life contour (shown in red) has a strongly defined minimum force amplitude that lies near the R=0 line.  Also notice how, at higher temperatures, the life contours start to reflect a decrease of life with increasing mean strain.

This interesting effect can easily by replicated in the Endurica fatigue solver by letting the strain crystallization effect depend on temperature.  The material definition we have used in this quick demo is given below in both the old hfi format and the new Katana json format.  I have highlighted in yellow those parts of the definition which reflect the temperature dependence.

In the material definition, we have reflected two behaviors:

  1. the increase of crack growth rate with temperature (ie the RC parameter), and
  2. the decrease of strain crystallization with temperature (ie the Mars-Fatemi exponential strain crystallization parameter FEXP).

We have plotted the resulting Haigh diagrams in the Endurica viewer, and directly overlaid Ruellan’s results for comparison.  Although the x and y scales in Ruellan’s results are shown in terms of total specimen force and ours are shown in terms of strain, a quite satisfying match is nonetheless achieved for the interaction of temperature with the mean strain effect.  It is especially satisfying that such rich behavior is so compactly and so accurately described by means of the Mars-Fatemi crystallization parameter.

twitterlinkedinmail

Get Durability AND Sustainability Right with Endurica

Sustainability is all about Precycling with Endurica

How do you respond to the call for sustainable solutions in the rubber industry?  Is it via bio-sourced polymers or fillers? elimination of carcinogenic additives from the compound? Inclusion of recycled content in the material?  light-weighting aimed at reducing material use or at fuel economy improvements?  supply of critical components to EVs?

There are many paths to sustainability, but they are all constrained by these three filters:

  1. Most alternatives risk a reduction in durability (despite the optimistic claims of suppliers).
  2. Your product still must pass its durability qualification requirements.
  3. The number of development iterations is severely limited by the time and cost of durability testing.

Endurica workflows have been driving a “right the first time” engineering culture for the last 14 years.  Putting durability characterization and simulation upfront in your development programs means that you find and resolve issues earlier and cheaper than if you depended only on your qualification to discover issues. 

With Endurica, you can rapidly evaluate the durability of a series of alternative materials under realistic conditions before you build the first physical prototype.  The impacts of polymer alternatives, filler alternatives, additives, recycled content alternatives, etc. can be characterized with a minimal sample of the material and represented accurately with Endurica’s material modeling capabilities.  You can see how material property changes play out in your actual part geometry, under actual part loading histories.  All without building a single prototype part.  The modeling process is simple to automate, enabling much richer explorations of the available design space.  Where a purely prototype-based development program may be able to compare two or three alternatives over a six-month period, a simulation-based program can compare several hundred alternatives in the space of a week! 

Just because it can be hard to find a sustainable alternative doesn’t mean that they aren’t out there.  It is their relative rarity that makes them so valuable.  The next crop of winning products will come from those who can quickly and reliably navigate durability.

twitterlinkedinmail

Towards better rubber compound selection: Introducing Endurica’s new Companion (TM) App

Endurica Companion App | Fatigue Property Comparator

Rubber can be formulated in a very wide range of properties.  For materials developers, this cuts two ways. On one hand, it means that there are almost always excellent options for a given application.  On the other, it means that those options are usually hidden among lots of bad options.  This is job security for rubber compounders, but it unfortunately also underlies the fact that there are so many instances of sub-optimal materials selection decisions when it comes to rubber.  One study found that more than 40% of rubber product failures could have been avoided with better materials selection.

One cause of this statistic is poor visibility into how material properties map into application performance.  Too often, the material options are judged based on an over-simplified lab test, or an incomplete specification of application conditions. We made the CompanionTM app to address this gap.  Companion makes it easier to find the rubber properties that ensure durability in your application.  Companion can compare materials for strain-, stress- and energy control.  It can compare applications with different modes of deformation (tension, compression, shear).  It can account for fully relaxing and nonrelaxing loading. It can account for temperature effects.

Another cause of too-high rates of poor materials selection is that sometimes different parts of an organization use incompatible approaches to specify, characterize and analyze the material and the application.  Gaps between the materials, product and testing silos sometimes create unnecessary confusion, conflict and wasted effort, leading to poor durability.  Companion was built with the aim of getting materials engineers and product engineers using a common, validated framework.  The material properties and analysis principles in the Companion App are the same as those used in our product simulation software, but the user experience in the app is centered around the materials selection decision.  No special knowledge of fatigue theory or simulation technology is needed to start using the app.

 With the Companion App you can choose different variables to see how they affect the performance of the rubber

You can use the basic version of Companion for free.  Go to companion.endurica.com to set up your account and try it out.  The free version lets you define one material and one loading condition.  A subscription-based professional version is also available for about $1 USD / day.  The subscription version lets you compare 2 materials and 2 load cases side-by-side, it lets you save your material definitions to a local database for future use, and it includes several outputs that give deeper insight into the fatigue behavior of your materials.  The workflow is simple: 1) define your material(s), 2) define your load case(s), 3) run the calculation, and 4) review the results and compare performance of the materials for the given load cases.

Give it a try and let us know what you think.

twitterlinkedinmail

Proper tear testing of elastomers: Why you should tear up the Die C tear test

Endurica Fatigue Ninja tearing rubber

I spent an interesting and rewarding part of my career helping to lead an elastomer technical college in Yanbu, Saudi Arabia. One of the rubber technology words that was challenging for the Saudis to say in English was ‘tear’. They initially pronounced it like the heteronym related to crying. It might be a stretch to say that tears will come to your eyes if you don’t get tear testing of elastomers right, but proper measurement of critical tearing energy (tear strength) is essential for effective materials development for durability.

The fatigue threshold (intrinsic strength; T0) is the lower limit of the fatigue crack growth curve shown in the figure below, and we recently reviewed this material parameter including the various measurement options.1 The upper limit is the tear strength, TC. If loads in your elastomer component are near or above TC, then it is not a fatigue problem anymore but rather a critical tearing issue with imminent product failure. It is therefore important to accurately characterize this durability performance characteristic of your materials.

General fatigue crack growth behavior of elastomers

Endurica uses the planar tension (pure shear) geometry for measuring TC in our Fatigue Property Mapping testing services due to the simple relationship between the strain energy density (W) and the energy release rate (tearing energy, T).2,3 The TC is equal to the W at tearing multiplied by the initial specimen height, h. You can see this geometry below along with other tear testing specimens employed in the rubber industry and specified in the ASTM standard.4

Comparison of the different durability tests one can conduct: the differences between Crack Nucleation Test and Tear and Crack Growth Tests.

We sometimes get questions from folks with technical backgrounds in metals or plastics about whether rubber tear properties will be different when tested in distinct testing modes (mode I, mode II, etc.). It turns out that the extensibility of rubber causes the deformation to be predominately tension in the tearing region, irrespective of how the crack is opened, such that TC values are similar for rubber evaluated in different testing modes.2,3 Therefore, trouser tear testing is an alternative to the planar tension testing, as long as any stretching of the legs is accounted for in the data analysis.3,5 With no stretching of the legs, TC is simply given by 2F/t where F is the measured force to propagate the tear and t is the thickness of the specimen. The factor of 2 is surprisingly omitted in the ASTM standard4 even though it is mentioned in the appendix. The image below shows how to convert the ASTM trouser tear strength to TC.

Trouser tear strength testing

A proper tear test includes an initial macroscopic cut/crack in the specimen. This is not the case for Die C tear described in the tear testing standard.4 Die C is thus not a tear test at all but rather is a crack nucleation experiment akin to normal tensile testing of rubber. Because the strange Die C geometry forces failure in a small region in the center of the specimen, it is actually less useful than tensile strength testing of a dumbbell sample which probes the entire gauge region. The Die C test can also have substantial experimental variability related to the sharpness of the die used to punch out the samples. Unfortunately, the Die C “tear” test is the most popular method in the rubber industry to (incorrectly) assess the tear strength of elastomers, and this reality was a key motivator for writing this post. We look forward to seeing the rubber industry shift away from the Die C test, and we hope that the information provided here will help in that path to #GetDurabilityRight. Click here to learn how intrinsic strength and tear strength can be measured quickly and accurately (0:42 video).

References

  1. Robertson, C.G.; Stoček, R.; Mars, W.V. The Fatigue Threshold of Rubber and its Characterization Using the Cutting Method. Advances in Polymer Science, Springer, Berlin, Heidelberg, 2020, pp. 1-27.
  2. Lake, G.J. Fatigue and Fracture of Elastomers. Rubber Chem. Technol. 1995, 68, 435-460.
  3. Rivlin, R.S.; Thomas, A.G. Rupture of rubber. I. Characteristic energy for tearing. J. Polym. Sci. 1953, 10, 291–318.
  4. Standard Test Method for Tear Strength of Conventional Vulcanized Rubber and Thermoplastic Elastomers. Designation: ASTM D 624-00, ASTM International, West Conshohocken, PA, USA, 2020; pp. 1-9.
  5. Mars, W.V.; Fatemi, A. A literature survey on fatigue analysis approaches for rubber. Int. J. Fatigue 2002, 24, 949–961.
twitterlinkedinmail

Durability Insights from the ISA for Tire Tread Compound Development

My last blog post (Getting a Quick Read on Durability with the Intrinsic Strength Analyser) highlighted a one-hour test on the Intrinsic Strength Analyser (ISA) to screen elastomer materials for long-term fatigue performance, with applications in materials R&D and plant mixing quality control. To illustrate the use of this approach for rubber compound development, we recently had the opportunity to collaborate with Dr. Nihat Isitman from Goodyear Tire & Rubber Company in Akron, Ohio and Dr. Radek Stoček from Polymer Research Laboratory in Zlín, Czech Republic.1 Dr. Isitman led this project and was scheduled to present our research at the Spring 2020 Technical Meeting of the ACS Rubber Division, but the meeting was cancelled due to COVID-19 precautions. Instead, the Rubber Division is offering the content online, and the meeting presentations are available here for a modest fee.

Our study considered model tread compounds based on the well-known green tire formulation, which is a compatible blend of solution styrene-butadiene rubber (SBR) and high-cis butadiene rubber (BR) that is reinforced with a silica-silane system for low rolling resistance (improved fuel economy) passenger tires. Additional production compounds used in actual tire treads were also tested, but the proprietary results for these materials were not included in the public presentation. The SBR/BR ratio, silica loading, and crosslink density were all varied in this investigation. For each rubber formulation, the ISA was used to measure the fatigue threshold (T0) and critical tearing energy (tear strength; Tc), which bracket the two ends of the fatigue crack growth curve as shown below.

 Intrinsic strength and tear strength

The established cutting method of Lake and Yeoh2,3 is used for assessing T0 on the ISA, and the one-hour test on this benchtop instrument is concluded with a tearing procedure to measure Tc. The ISA is manufactured by Coesfeld GmbH & Co. in Dortmund, Germany, and distributed in the Americas by Endurica LLC (see photo).

The Intrinsic Strength Analyser manufactured by Coesfeld GmbH & Co. in Dortmund, Germany, and distributed in the Americas by Endurica LLC

The slide image below summarizes the key findings of this research collaboration. Optimization of T0 and Tc is possible thanks to different sensitivities to the various compounding variables. It is important to measure both fatigue threshold and tear strength to quantify durability potential of rubber materials, and the ISA is an efficient and effective instrument for these measurements. To learn more about this testing equipment for the rubber lab, please visit our Instruments page and contact us at info@endurica.com with questions.

 Summary of key findings of this research collaboration

References

  1. N. Isitman, R. Stoček, and C. G. Robertson, “Influences of compounding attributes on intrinsic strength and tearing behavior of model tread rubber compounds”, paper scheduled to be presented at the 197th Technical Meeting of the Rubber Division, ACS, Independence, OH, April 28-30, 2020 (online presentation due to meeting cancellation).
  2. G. J. Lake and O. H. Yeoh, “Measurement of Rubber Cutting Resistance in the Absence of Friction”, International Journal of Fracture 14, 509 (1978).
  3. C. G. Robertson, R. Stoček, C. Kipscholl, and W. V. Mars, “Characterizing the Intrinsic Strength (Fatigue Threshold) of Natural Rubber/Butadiene Rubber Blends”, Tire Sci. Technol. 47, 292 (2019).
twitterlinkedinmail

Getting a Quick Read on Durability with the Intrinsic Strength Analyser

There is now a one-hour test on a benchtop instrument for the rubber lab to screen materials for long-term fatigue performance. Please continue reading to learn more about this commercialization of a classical elastomer characterization methodology.

Rubber products manufacturers and raw materials suppliers seeking improved materials for next-generation applications depend on lab tests to predict end-use performance. These predictive tests should balance accuracy, relevance, and testing time. The testing time component is particularly challenging when the performance characteristic of interest is fatigue lifetime. The image of traditional fatigue testers chattering along for days or weeks comes to mind for those of us with experience in industrial rubber labs. The time consideration is the reason why tensile stress-strain testing (stretching a material to high strains until failure) is the most common physical test for the fracture behavior of rubber, in clear contrast to the most prevalent application condition for rubber products which is cyclic loading (fatigue) at much lower strains.

Fatigue crack growth is a key element of elastomer behavior that must be determined in order to predict durability, as illustrated below. For example, fatigue crack growth (FCG) testing provides the FCG rate law that is essential for predicting when and where cracks will show up in rubber products using Endurica’s elastomer fatigue software for finite element analysis [https://endurica.com/integrated-durability-solutions-for-elastomers/]. Endurica has developed a finitely scoped, reduced variability measurement approach1 which is used in our Fatigue Property Mapping testing services and is available on the Coesfeld Tear and Fatigue Analyser (TFA). Our standard FCG measurement protocol takes 20 hours of continuous testing. This testing time is very efficient for characterizing best candidate materials in the development process, but a faster test is needed for narrowing down, for example, 20 initial materials to 5 best candidates or for use in a plant lab to monitor quality of rubber compounding processes.

Key Components of Elastomer Fatigue and Failure

The Intrinsic Strength Analyser (ISA) is a recent addition to the durability testing solutions for elastomers. The ISA was developed through a partnership between Coesfeld GmbH & Co. (Dortmund, Germany) and Endurica LLC (Findlay, OH, USA), and this benchtop instrument employs a testing protocol based on the long-established cutting method of Lake and Yeoh.3,4 Endurica’s president, Dr. Will Mars, discusses the importance of measuring intrinsic strength (fatigue threshold) in this video on our YouTube channel which also shows some footage of the ISA in operation:

https://www.youtube.com/watch?v=BL92ppsJZfE

The fatigue crack growth curve of rubbery materials is bounded by the fatigue threshold, T0, on the low tearing energy (T) side and by the critical tearing energy (tear strength), Tc, at the high-T end. This is depicted in the generalized figure below. A streamlined one-hour procedure on the ISA can measure both T0 and Tc which can then be used to estimate the slope (F) of the intermediate FCG power law response that correlates well with the actual F from rigorous FCG testing using the TFA (see figure). More information about this quick ISA approach to characterizing rubber crack growth behavior for materials development and quality control can be found in the Annual Review 2019 issue of Tire Technology International (open access).2

ISA graph showing Crack Growth Rate compared to tearing energy

The fatigue crack growth slope

The fatigue crack growth slope, F, from the ISA should be considered an approximate value that is useful for comparing the relative FCG behavior of materials. However, the determination of T0 on the ISA is highly quantitative and the only realistic option for assessing this parameter, since the near-threshold crack growth testing on the TFA needed to define T0 would take about a month. The implementation areas for the ISA and TFA are compared in the following table. A very conservative approach to product development for elastomer durability is to create a combination of material behavior and component design that places the final operation of the rubber product below the fatigue threshold. If this is your company’s approach to engineering for durability, then the ISA is the testing instrument you need.

Durability Testing Solutions for the Rubber Lab

Crack precursor size is another key characteristic of elastomers that needs to be quantified in order to predict durability. In combination with a standard tensile stress-strain test, the critical tearing energy (Tc) from the ISA can also be used to assess crack precursor size, as we showed recently in an open access publication.5

Endurica is the exclusive Americas distributor of the Coesfeld ISA and TFA instruments. Endurica’s efficient and effective testing protocols are provided on these high-quality instruments for the rubber laboratory. To learn more about how to add these testing capabilities to your lab, please contact us at info@endurica.com.

References

  1. J. R. Goossens and W. V. Mars, “Finitely Scoped, High Reliability Fatigue Crack Growth Measurements”, Rubber Chem. Technol. 91, 644 (2018).
  2. C. G. Robertson, R. Stoček, R. Kipscholl, and W. V. Mars, “Characterizing Durability of Rubber for Tires”, Tire Technology International, Annual Review 2019, pp. 78-82.
  3. G. J. Lake and O. H. Yeoh, “Measurement of Rubber Cutting Resistance in the Absence of Friction”, International Journal of Fracture 14, 509 (1978).
  4. C. G. Robertson, R. Stoček, C. Kipscholl, and W. V. Mars, “Characterizing the Intrinsic Strength (Fatigue Threshold) of Natural Rubber/Butadiene Rubber Blends”, Tire Sci. Technol. 47, 292 (2019).
  5. C. G. Robertson, L. B. Tunnicliffe, L. Maciag, M. A. Bauman, K. Miller, C. R. Herd, and W. V. Mars, “Characterizing Distributions of Tensile Strength and Crack Precursor Size to Evaluate Filler Dispersion Effects and Reliability of Rubber”, Polymers 12, 203 (2020).
twitterlinkedinmail

Calibrating Crack Precursor Size in Endurica CL

Crack precursors exist in all elastomers owing to the heterogeneous microstructure, even before any loads are applied. The size of the typical precursor must be specified as part of the Endurica fatigue analysis workflow.  The best practice for finding the precursor size is to leverage both crack growth and crack nucleation experiments to enforce agreement between the nucleation test results and the corresponding simulation-predicted life results.  This procedure guarantees that both the crack growth and the crack nucleation experiments add up to an overall consistent story. 

Prior to performing the calibration, you will need to have already defined the hyperelastic law, and the fatigue crack growth rate law. Fatigue models used for rubber have the following parameters:

  • Relationship between tearing energy and crack growth rate
    • The parameters needed to define this relationship are obtained through fatigue crack growth experiments. The crack is loaded under a range of tearing energies while tracking growth of the crack. These tests obtain the critical tearing energy, Tc, which is the tearing energy at which the crack reaches end of life failure in one loading. The crack growth rate at critical tearing energy, rc, and the slope of the curve, F, are determined by fitting a power law to the experimental crack growth and tearing energy.
  • Threshold
    • This is the tearing energy limit T0 below which cracks do not grow. If you do not specify this parameter, then you will use the Thomas law. If you do specify this parameter, you will use the Lake-Lindley law.  The threshold can be measured using an Intrinsic Strength experiment.
  • Strain Crystallization
    • Some rubbers exhibit a strain crystallization behavior that causes an increase of durability under non-relaxing loads. If the duty cycle of your calibration experiment is nonrelaxing, and if you have a strain crystallizing material, then this characterization should be completed before calibrating the precursor size.  The strain crystallization effect is measured in the non-relaxing module.
  • End of life crack size
    • This parameter should be set in the material definition prior to calibrating the precursor size. A default value of 1mm is generally adequate, particularly when it turns out that the precursor size is at least 5x smaller than this value.  The part is considered to have failed when a crack reaches this size. 

The crack nucleation experiment used for the calibration procedure may be made on a material test coupon, or on an actual component.  Test coupons are convenient in early development stages as they do not require having a part to test.  So long as crack precursor size is controlled by intrinsic features of the compound recipe (and not by the extrinsic features of post-mixing processes), a test coupon is likely to give useful results.  There is a risk when using a test coupon: the risk that the precursor size in a manufactured part is actually controlled by some feature of post-mixing process such as factory contamination, part molding, abrasion, etc.  This risk can be mitigated by calibrating precursor size on the basis of crack nucleation experiments on the finished part.  In the following example, we show the process for calibration based on a finished part.  The process for a test coupon is the same, but the model of the part is replaced by a model of the specimen. 

To illustrate, take the case of a rubber bumper spring. Its duty cycle consists of compressing the 150 mm long rubber spring by 80 mm. Experiments show a fatigue life of 282,534 cycles for this duty cycle. A finite element analysis of the rubber spring is made to obtain strain history. The rubber spring is shown in the image below at the initial condition, at 50% of the displacement, and at 100% of the displacement during the fatigue duty cycle.

The rubber spring at the initial condition, at 50% of the displacement, and at 100% of the displacement during the fatigue duty cycle


We are now ready to calibrate the as yet unknown precursor size to the known experimental fatigue test result of the spring. The precursor size can be calibrated by calculating the fatigue life for a series of precursor sizes and then interpolating to find the one precursor size that results in the best agreement between fatigue life calculations and the experimental fatigue life. Use the PRECURSORSIZE_CALIBRATION output request in Endurica CL to produce a table of fatigue life vs. crack precursor size. Your output request syntax will look something like this:

**OUTPUT

PRECURSORSIZE_CALIBRATION, NFS=25, FSMIN=1e-2
LIFE

NFS is the number of precursor sizes to evaluate, in this case 25.  FSMIN is the smallest precursor size to evaluate, in this case 0.01 mm. 

Once you’ve executed the calibration, use the new Endurica Viewer to complete the calibration workflow. It can plot a wide range of Endurica analysis outputs including precursor size calibration. Just open the Endurica output file containing the calibration results and expand the output file contents tree to find the Precursor Size Calibration results.  The viewer then plots the computed table of precursor size vs fatigue life.

The viewer plots the computed table of precursor size vs fatigue life


If you click on the plot options in the upper left corner, you can input the target life and the viewer will interpolate the precursor size. In this case, for a life of 282,534 cycles, the corresponding precursor size is 39 microns. Now that the precursor size is calibrated, the spring geometry can be optimized, different loadings analyzed, or entirely different parts can be analyzed using the material model to get fatigue life results that accurately reflect the precursor size that is most representative of the final material in the part. Again, if a part is not available, precursor size can also be calibrated to fatigue results from standard simple tension test specimen.

The calibrated rubber spring FE model with the life result of 282,534 cycles is shown below.

The calibrated rubber spring FE model with the life result of 282,534 cycles is shown below.

twitterlinkedinmail

Integrated Durability Solutions for Elastomers

Will the durability of your new rubber product meet the expectations of your customers? 

Do you have a comprehensive capability that fully integrates all of the disciplines required to efficiently achieve a targeted durability spec?

Your engineers use finite element analysis (FEA) to model the elastomer component in the complex geometry and loading cycle for the desired product application.  One traditional approach to predicting durability is to develop a rough estimate of lifetime by looking at maximum principal strain or stress in relation to strain-life or stress-life fatigue curves obtained for the material using lab specimens in simple tension.  The difficulties and uncertainties with this method were discussed in a recent blog post.

a rough estimate of lifetime by looking at maximum principal strain or stress in relation to strain-life or stress-life fatigue curves obtained for the material using lab specimens in simple tension


A modern approach to elastomer durability is to use the Endurica CL™ durability solver for FEA.  This software uses rubber fracture mechanics principles and critical plane analysis to calculate the fatigue lifetime – which is the number of times the complex deformation cycle can be repeated before failure – for every element of the model.  This provides engineers with the ability to view lifetime throughout the FEA mesh, allowing them to modify design features or make material changes as needed to resolve short-lifetime areas.

view lifetime throughout the FEA mesh, allowing them to modify design features or make material changes as needed to resolve short-lifetime areas.

A sound finite element model of the elastomer product in the specified loading situation and fundamental fatigue material parameters from our Fatigue Property Mapping™ testing methods are the two essential inputs to the Endurica CL software.  This is illustrated in the figure below.

A sound finite element model of the elastomer product in the specified loading situation and fundamental fatigue material parameters from our Fatigue Property Mapping™ testing methods are the two essential inputs to the Endurica CL software.

The requisite elastomer characterization methods can be conducted by us through our testing services or by you in your laboratory with our testing instruments.  For some companies, consulting projects are a route to taking advantage of the software before deciding to license the unique predictive capabilities.  The following diagram shows how our products and services are integrated.

Durability Solutions for Elastomers

For companies that are just getting started with implementing our durability solutions, the following is a typical testing services and consulting project:

  1. We use our Fatigue Property Mapping™ testing methods, through our collaboration with Axel Products Physical Testing Services, to characterize the properties of cured sheets of rubber compounds sent to us by the client. The minimum requirements for fatigue modeling are crack precursor size and crack growth rate law, and these are quantified within our Core Fatigue Module.  Special effects like strain-induced crystallization and aging/degradation are accounted for using other testing modules when applicable.
  2. The client sends us the output files from their finite element analysis (FEA) of their elastomer part design for the deformation of their complex loading cycle. It is common for the goal to be a comparison of either two designs, two distinct loading profiles, two different rubber compounds, or combinations of these variations.  Our software is fully compatible with Abaqus™, ANSYS™, and MSC Marc™, so the simulations can be conducted on any of these FEA platforms.  In some situations where a client does not have their own FEA capabilities, one of Endurica’s engineers will set up the models and perform the analyses instead.
  3. The fatigue parameters and FEA model are inputted to Endurica CL fatigue solver to calculate values of the fatigue lifetime for every element of the model. The lifetime results are then mapped back onto the finite element mesh in Abaqus, ANSYS, or MSC Marc so that the problem areas (short lifetime regions) within the geometry can be highlighted.
  4. We review the results with the client and discuss any opportunities for improving the fatigue performance through design and material changes.

Advanced implementors of our durability solutions have licensed the Endurica CL software and are using our rubber characterization methods in their laboratories on a routine basis, with instruments provided through our partnership with Coesfeld GmbH & Co. (Germany).  One recently publicized example of a company using the Endurica approach to a very high degree is Tenneco Inc., which you can read about here.

We want to help you #GetDurabilityRight, so please contact us at info@endurica.com if you would like to know more about how Endurica’s modern integrated durability solutions for elastomers can help enable a product development path that is faster, less expensive, and more confident.twitterlinkedinmail

close
Trial License RequestTrial License RequestTrial License RequestTrial License RequestTrial License Request

Our website uses cookies. By agreeing, you accept the use of cookies in accordance with our cookie policy.  Continued use of our website automatically accepts our terms. Privacy Center