Keeping Your Secrets

Keeping your Secrets

The old saying “loose lips sink ships” is as true in product development as it is in war.  Maybe more so – while warships are heavily armored, intellectual property is never more secure than the least ethical person’s willingness and ability to misappropriate.  And the stakes have never been higher. Simulation software makes it easier than ever to document material properties, geometry, physics and functions of your next product.  So, collaborators can communicate design intentions more easily and more fully than ever before.  The downside?  It’s easier than ever for an adversary (or the next disgruntled employee) to walk out with your crown jewels!

This is why we’ve just implemented an encryption feature in the Endurica fatigue solvers.  Now you can password-protect sensitive information.  You control which information gets encrypted, and which stays as plain text.  You can share material property or load case definitions for use by collaborators without revealing private details in which you are heavily invested.

Here is a quick demo of how the new feature works.  Check it out.

One more way we are helping you to win on durability.

twitterlinkedinmail

Two Decades of Critical Plane Analysis

Critical Plane Analysis

It has been 20 years since Critical Plane Analysis for rubber was first conceived and validated.  There were early signs of its significance.  It won awards wherever I presented it. At the 1999 SAE Fatigue Design and Evaluation meeting, it won the Henry Fuchs award.  At the 2000 Tire Society meeting, it won the Superior Paper award. At the Fall 2000 ACS Rubber Division meeting, it won the Best Paper award.  Upon completing my 2001 doctoral thesis, we applied for and received a US patent (2003) on it.

The strongest early sign was that I soon found myself in company with others pursuing similar thinking.  The earliest was Dr. Nicolas Saintier.  As far as I know, neither of us was aware of the other’s work until 2006.  That was when he published an account similar enough to my own that when it came across my desk and I first started to read it, I felt certain he would cite my 2001 work as a source.  I have to admit to initially feeling let down when I reached the end of his paper and found no mention of my work.  I immediately looked for his other papers and found his 2001 doctoral thesis titled “Fatigue multiaxiale dans un élastomère de type NR chargé: mécanismes d’endommagement et critère local d’amorçage de fissure.” (Multiaxial fatigue life of a natural rubber: crack initiation mechanisms and local fatigue life criterion).  There it was – the same founding principle of Critical Plane Analysis that I had worked so hard to articulate and validate – the idea that cracks develop on a material plane, specifically the most critical material plane, and that their localized experience drives their evolution.  That we both articulated this beautifully simple and powerful principle in the same year with complete independence from each other, when no one else working on elastomers had yet spoken of this approach (there were precedents in the field of metal fatigue analysis), just shows that it was an idea whose time had come.

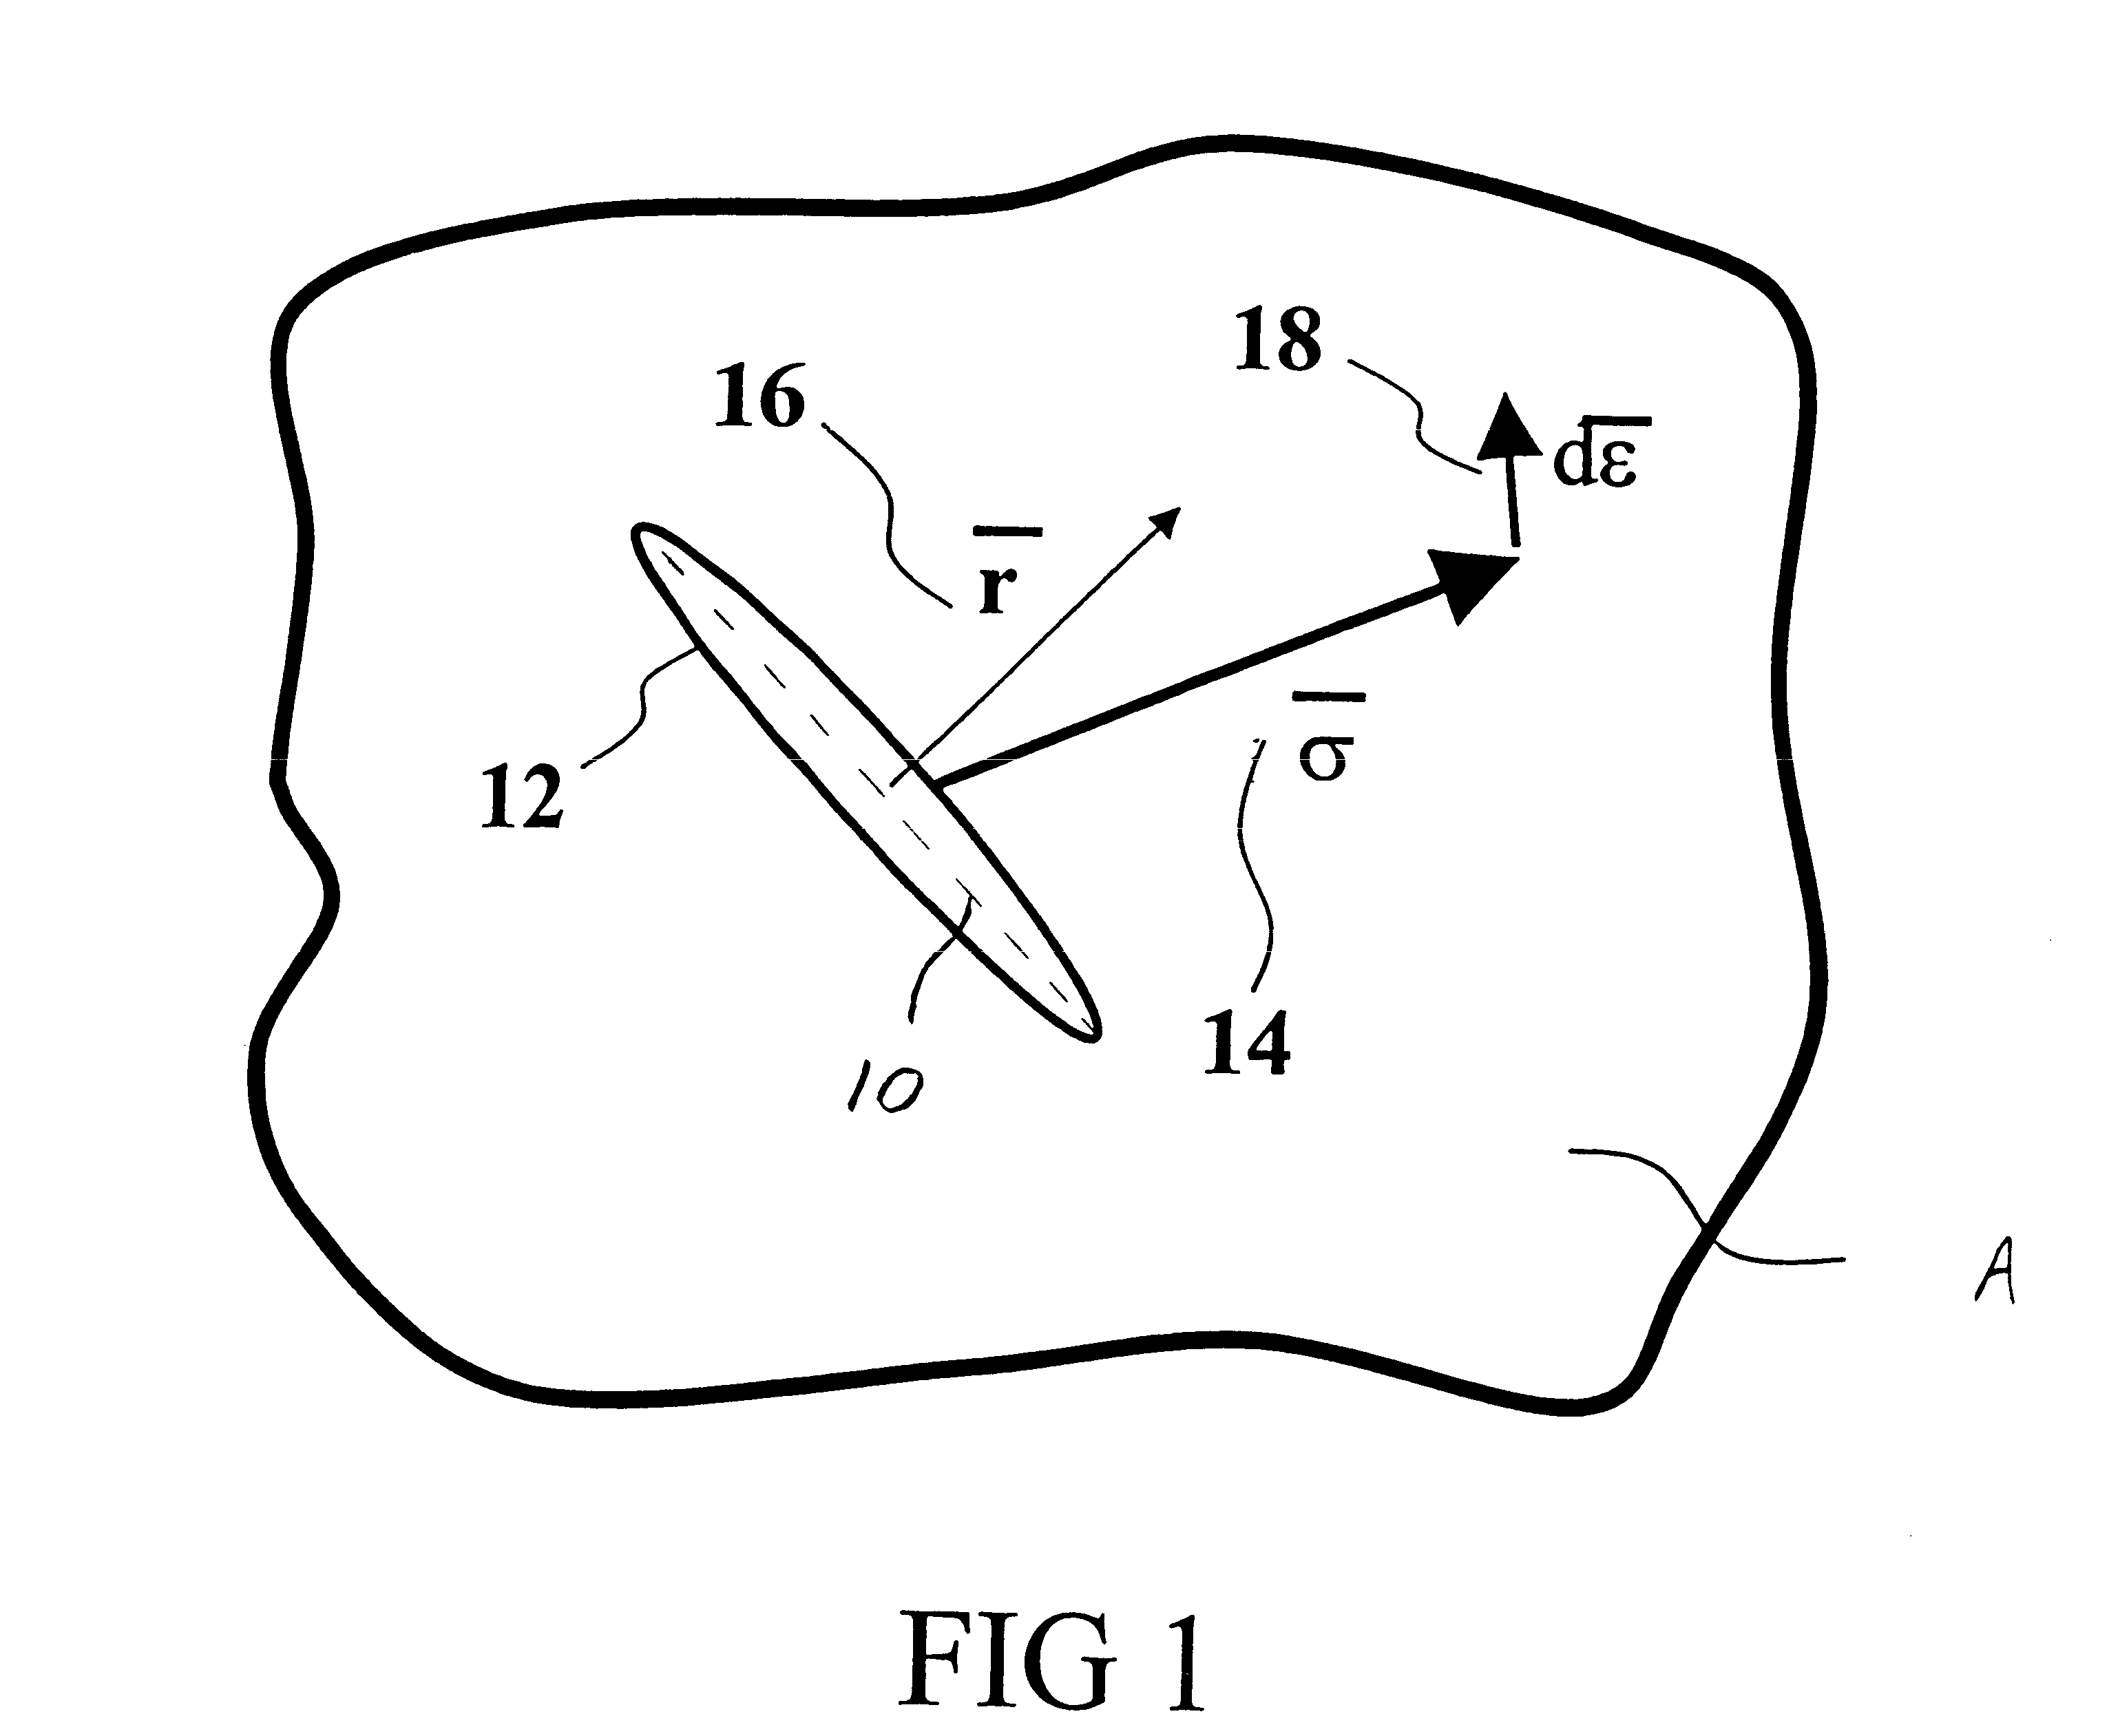
Although the foundational principle of Critical Plane Analysis was the same, there were also important differences between our accounts.  We differed on 1) how the critical plane is selected, 2) what criterion is used to quantify the severity of loading experience by the critical plane, 3) how damage on the critical plane evolves under solicitation.  The following table summarizes the key differences:


Table 1. Comparison of the Mars and Saintier Frameworks for Critical Plane Analysis.

Mars 2001 Saintier 2001
Critical Plane Selection Method Minimize the computed life after evaluation of damage on all planes Maximize the principal stress prior to evaluation of damage
Multiaxial Criterion Energy release rate estimated via cracking energy density on every plane Stress traction on the assumed critical plane
Damage Evolution Law Integration of crack growth rate law Power law Wohler curve
Strain Crystallization Law Treated as R ratio dependence of the crack growth rate law Treated as a modifier of the stress experienced on the critical plane

It may be said that Saintier’s approach followed more closely the precedents for Critical Plane Analysis in metal fatigue, particularly with respect to the method used to select the critical plane.  Selecting the plane is the first step in his method (identify the plane in order to compute the damage), but it is the last step in our method (compute the damage on each plane first and lastly pick the plane with the most damage).  Saintier’s approach also depends on a Wohler curve style characterization of fatigue behavior, where ours is defined via a crack growth rate law.  We have previously discussed the pros and cons of Wohler curves vs. fracture mechanics.  In our approach, we placed a high priority on taking advantage of the very large pre-existing body of knowledge on the fracture mechanical behavior of elastomers, and on the economic and operational advantages that crack growth experiments enjoy.

Since my and Saintier’s first steps, there have now been many others who have contributed in various forms to the overall method, its validation and/or its application.  It is safe to say that Critical Plane Analysis is here to stay, and set to continue expanding for many years (there are now several hundred research papers!).

For our part, Endurica is now in year 12 of delivering commercial grade fatigue analysis solutions built on this method.  Today, Critical Plane Analysis is a production analysis workflow used by many engineering organizations to solve critical durability issues.  It is the heart of the Endurica fatigue solver, and there are hundreds of trained users (look up the #fatigueninjas on twitter!).  It is unrivaled for its reliability, speed and accuracy in computing the impacts of multiaxial loading on durability.

What do the next 20 years hold?  We are going to see a transition in how fatigue analysis is used.  OEM organizations that manage durability and risk across rubber component supply chains will transition away from receiving fatigue simulation results on an optional basis towards requiring fatigue simulations by default on every part at the inception of new programs.  Expectations and achievement of cost-reduction, light weighting and sustainability initiatives will increase as product optimization begins to fully account for actual product use cases.  Critical Plane Analysis has already laid the foundation for these things to happen.  Older fatigue analysis methods that do not compete well against critical plane methods will become obsolete.  On the research side, there will be further development of material models for use in the critical plane framework.  Ageing, inelasticity, rate and anisotropy effects still need further development, for example.  In 20 years, durability will be just one more thing that engineers do well every day, whether or not they know that Critical Plane Analysis was how they did it.

Mars, W. V,  Multiaxial fatigue of rubber. Ph.D. Dissertation, University of Toledo, 2001.

Mars, W. V. “Multiaxial fatigue crack initiation in rubber.” Tire Science and Technology 29, no. 3: 171-185, 2001.

Mars, W. V. “Cracking energy density as a predictor of fatigue life under multiaxial conditions.” Rubber chemistry and technology 75, no. 1: 1-17, 2002.

Mars, W. V., “Method and article of manufacture for estimating material failure due to crack formation and growth.” U.S. Patent No. 6,634,236. 21 Oct. 2003.

Saintier, N, “Fatigue multiaxiale dans un élastomère de type NR chargé: mécanismes d’endommagement et critère local d’amorçage de fissure.” Ph. D Dissertation., Ecole des Mines de Paris, 2001.

Saintier, N, G. Cailletaud, R. Piques. “Crack initiation and propagation under multiaxial fatigue in a natural rubber.” International Journal of Fatigue 28, no. 1: 61-72, (2006).

twitterlinkedinmail

Fatigue Property Mapping 2.0

Fatigue Property Mapping Logo

We have just launched a few updates to our Fatigue Property Mapping service offerings.  The changes were:

  1. Addition of the all new Reliability Module for those needing to compute probability of failure in addition to fatigue life. The module gives you Weibull parameters to describe the statistical distribution of crack precursor sizes in your material.
  2. Addition of a pressure-volume test as an optional add-on to the hyperelastic module. Use this add-on when your rubber is loaded under high confinement to the point where its compressibility must be treated more accurately.  If the hydrostatic pressure is more than 5% of the bulk modulus, then this option makes sense.
  3. Split of the original Thermal Module in two components: a Basic Thermal Module and an Advanced Thermal Add-on Module. The Basic Thermal Module provides a dynamic strain sweep to quantify dissipation (for use in computing temperature distribution via FEA) and also provides the temperature sensitivity coefficient on the crack growth rate law.  The advanced module provides thermal transport properties (conductivity, specific heat), thermal expansion coefficient (for computing thermal pre-stresses), and additional data points for the dissipation and crack growth rate laws.
  4. Split of the original Extended Life (Ageing) Module into two parts: a Basic Ageing Module and a Master Curve Module. The basic module includes characterization of unaged and aged samples for stiffness, critical fracture energy, and intrinsic strength.  The oven exposure time and temperature for the aged sample is specified by the client, or can be set by Endurica based upon a client-specified life target.  The Full Master Curve Module gives both the Arrhenius law activation energy and a master curve showing how stiffness, critical fracture energy and intrinsic strength depend on exposure time and temperature.

Most prices have remained the same, except for the Thermal and Ageing modules.  The Thermal and Ageing modules have now been significantly streamlined, so that we now offer service at a lower price.

The new price list and specifications can be found here.

twitterlinkedinmail

Conservatism and Tradition in Fatigue Analysis

Slide Rule

Because Endurica’s Critical Plane Analysis is a relatively new approach to fatigue analysis of elastomers (introduced in 2001), new users often ask whether its predictions are conservative: i.e., does its predictions reliably lean in favor of safety? And is it more or less conservative than the traditional approaches it supplants?

Fatigue analysis for elastomers follows two distinct traditions.  The earliest tradition traces to Sidney Cadwell’s work in 1940 which followed the even earlier ideas of metal fatigue pioneer August Wohler.  This tradition is based on matching up empirical crack nucleation curves to corresponding in-service operating conditions via convenient parameters such as stress or strain.  It is typically the first approach that engineers encounter in their undergraduate training, as it is often effective and relatively simple to apply.  A later tradition, Fracture Mechanics, traces to the post-WWII work of Ronald Rivlin and Alan Thomas in 1953 which extended Griffith’s seminal 1921 work on rupture to elastomers.  In this tradition, the energy requirements for growing a given crack provide the core organizing principle for analysis.  Combined with empirical crack growth rate curves, this approach can make high accuracy life predictions for a very broad range of application scenarios. This approach is typically first encountered in graduate-level engineering programs, and due to somewhat more complicated mathematics, usually requires specialized calculation software to apply it.

There are a few big holes in the Wohler curve approach.  For elastomers, perhaps the biggest limitation is that this approach assumes a priori that damage is associated with the maximum principal stress or strain.  This is sometimes true for simple cases, but not always: 1) strain crystallization is known to produce off-axis cracking not aligned with the principal stress, 2) compression is known to produce cracks on planes of maximum shearing, and 3) out-of-phase multiaxial loading cases do not even possess a unique, well-defined principal direction – the directions vary in time.  It is also well known that Wohler curves for rubber depend strongly on mode of deformation.  Fatigue experiments in simple tension, biaxial tension, simple shear, and simple compression do not simply resolve to a single universal curve, as the Wohler approach takes for granted.  To use this approach conservatively then requires that the most damaging mode of deformation – simple tension – be used as the baseline.

Perhaps the biggest limitation of the traditional Fracture Mechanics approach is that it typically focuses on only one crack at a time.  In fatigue, structures begin with many microscopic cracks distributed randomly throughout.  Most of the fatigue life of the structure is spent growing many small cracks.  Only towards the very end of life do one or a few large cracks finally emerge as worst cases.  True conservatism would mean tracking the growth of all of possible large cracks, and finding out which one(s) grow the fastest.  But traditional fracture mechanics tools are not well adapted for this task.  They require up front assumptions about the location and shape of the worst case crack.  How can you find a worst case without considering many alternatives?

Critical Plane Analysis is simply the idea that a crack could occur anywhere in a structure, and it could occur in any orientation.  It checks all of the possibilities, and it finds the worst ones.  It looks at the specific loading experiences of each individual crack plane that might occur.  It takes account of material behavior like strain crystallization.  It takes account of crack closure conditions.  It takes account of the fracture mechanical behavior of small cracks.  It does not make unwarranted assumptions about the orientation of cracks.  It correctly predicts the orientation of cracks for all modes of deformation.  It is the most exhaustive and conservative fatigue analysis that you can do.

Don’t mistake traditional approaches with the conservative approach.  Critical Plane Analysis is, by definition, the most conservative approach because it doesn’t make any assumptions about crack location or orientation, and because it checks all of the possible ways a crack might occur.

twitterlinkedinmail

It Isn’t Durable Unless It’s Reliable

Endurica for Reliability and Durability

A brand promise of durability (i.e. fitness for service over a suitable period) doesn’t mean much unless it is delivered reliably (i.e. with high consistency).  When automakers provide a 100k mile warranty, for example, it is not enough to simply hit the promised life on average.  Falling short of the promised life should occur only very rarely, if at all.

What effort can be justified in pursuing reliability?  A quick way to estimate economic impact is to look at your product’s warranty adjustment rate.  If your manufacturing contract is worth $10 million dollars / year, and your customer returns 1% of the product for premature failures, then you have an opportunity to save $100k / year by eliminating premature failures.  This is a conservative estimate.  If your early failure rate is notably higher than your competition’s, for example, you may find yourself losing contracts or being forced into price concessions that aren’t sustainable.  A high failure rate may also result in legal liability for losses caused by your part.  In this sense, the total value in achieving reliability can actually approach or even exceed the value of your business!

So in design, consider not only the expected life of the most common crack precursor for your material (half of the samples in your population will have shorter life than this!), but consider also the life of the rare oversized crack precursor that occurs 1 time in 100, or 1 time in 1 million.  We recently launched a new Reliability Module to produce these statistics for exactly this purpose, check it out.  Think of it as a way to put a probability-based “safety factor” on fatigue life predictions.

twitterlinkedinmail

Solving the Durability Puzzle

Solve the Durability puzzle with EnduricaEver thought about what it takes to deliver the durability you expect from products you use? Durability reflects the combined sum of many decisions made all along the supply chain. What sources to use for raw materials? What dimensions and shape for product features? Are there OEM- or customer-imposed design constraints? What load cases occur in manufacturing, shipping, installation, and operation? Manufacturing processes? OEM-specified qualification and / or regulatory testing requirements? What is the warranty or brand promise? If these decisions are not made well, then durability (as well as cost and weight) will suffer.

The people making these decisions come from many backgrounds.  They are chemists, product engineers, testing engineers, structural analysts.  The big challenge is to organize things so that their contributions all add up to the desired end result: getting durability right, preferably on the first try.  It’s a big challenge because the domain expertise and tools in place today in many organizations were largely built before the science was ready and before the workflows were understood well enough to integrate across disciplines.  This situation can make it quite difficult to solve the durability puzzle.  The pieces don’t all fit together!

  • Oversimplified lab tests whose relationship to actual product use is doubtful
  • Fatigue testing instruments that produce noisy data, or execute with uncontrolled test duration
  • Raw materials suppliers struggling to relate chemistry and process improvements to actual impact on end products
  • Compounders making materials selection decisions based on insufficient / poor information
  • Product engineers missing opportunities to fully leverage material capacity
  • Outdated and inaccurate ‘rule of thumb’ engineering that doesn’t work on new cases
  • Incomplete simulation efforts that fail to forecast or diagnose key durability issues
  • Product qualification tests that under- or over-solicit damage or change failure modes
  • Part suppliers leaving OEMs with too little confidence that durability issues have been handled
  • OEMs and part suppliers struggling to account for actual end-use load cases

Endurica-powered workflows overcome these barriers.  Our training, testing services, testing instruments, and CAE software solutions integrate across disciplines.  Our motto is “Get Durability Right”.

Our classes are geared specifically for your compounders, test engineers, product engineers and analysts.  Your compounder doesn’t need to be a mechanical engineer, but she does need to negotiate the demands on the material.  Your product engineer and your analyst don’t need a PhD in chemistry, but they do need to push for performance that will win for the customer.  Your test engineer needs reliable, productive measurement strategies that get the key information that will power up your materials and product development efforts.  Our classes will pay for themselves many times over when your team confronts the next durability pitfall. 

Our testing services and testing instruments produce a complete picture of what limits durability in your application.  Rubber exhibits many ‘special effects’, and our tests are very useful for quantifying each effect, for building material models, and for solving and diagnosing durability issues.  We partner with leading labs around the world to bring you fast and reliable testing for durability simulation.  We partner with testing instrument maker Coesfeld to bring our protocols directly to your own lab with automated, user-friendly control, measurement and data reduction.  Analysts, designers and materials engineers all need clean, abundant, high-relevance measurements. 

Our software (Endurica CL, Endurica DT, Endurica EIE and fe-safe/Rubber) provides the most complete set of durability analysis capabilities in the world.  Total life, incremental damage, residual life, critical plane analysis, rainflow counting, nonlinear loads mapping, road load signal analysis, stiffness loss co-simulation, self-heating – its all here: documented, supported, validated, with examples and a large user-base.  We support the Abaqus, Ansys and MSC/Marc Finite Element solvers.  Use our software to see how different materials, different geometry, different load / use cases impact durability.  If your materials, product, analysis or testing people can ask the question, chances are that our tools will simulate it and give you new insights. 

Durability doesn’t have to be a difficult puzzle.  It costs way too much when people from different disciplines don’t “speak the same language” and try to go forward with conflicting ideas and tools.  Solve the puzzle by using pieces that fit together.  Get your team speaking Endurican!

Keywords: Compounding, Design, Testing, Analysis, Training

twitterlinkedinmail

Will Mars on the Rubber Industry: A Look Back 10 Years, Where We Are Now, A Look Ahead 10 Years

 Dr. William V. Mars Q: With regards to fatigue life prediction methods, where was the rubber industry 10 years ago?

Will There was plenty of great academic work and good understanding of fundamentals, but the methods were only deployed – if at all – via “homebuilt” solutions that could never support a broad enough audience to really impact daily product design decisions.  Simulation methods and experimental methods shared theoretical foundations but they were poorly integrated.  They suffered from operational problems, noisy data and open-ended test duration.  It was possible to analyze a crack if you could mesh it, but the added bookkeeping and convergence burdens were usually not sustainable in a production engineering context.  Mostly, analysts relied on tradition-based crack nucleation approaches that would look at quantities like strain or stress or strain energy density.  These were not very accurate and they were limiting in many ways, even though they were widely used.  They left companies very dependent on build and break iterations.

Q: Where is the industry today?

Will: The early adopters of our solutions have been off and running now for a number of years.  Our critical plane method has gained recognition for its high accuracy when dealing with multiaxial cases, cases involving crack closure, cases involving strain crystallization.  Our testing methods have gained recognition for high reliability and throughput.  Our users are doing production engineering with our tools.  They are consistently winning on durability issues.  They are handling durability issues right up front when they bid for new business.  They are expanding their in-house labs to increase testing capacity and they are winning innovation awards from OEMs.  They are using actual road-load cases from their customers to design light-weight, just-right parts that meet durability requirements.  The automotive industry has lead adoption but aerospace, tires, energy, and consumer products are also coming up.  We have users across the entire supply chain: raw material suppliers, component producers and OEMs.  The huge value that was locked up because durability was previously so difficult to manage is now unlocked in new ways for the first time.  This has been the wind in Endurica’s sails for the last 10 years.

Q: Where do you see the industry in 10 years?

Will: In 10 years, OEMs will expect durability from all component producers on day 1, even for radical projects.  They will expect designs already optimized for cost and weight.  They will push more warrantee responsibility to the supplier.  They will monitor durability requirements via shared testing and simulation workflows.  Suppliers will pitch solutions using characterization and simulation to show their product working well in your product.  The design and selection of rubber compounds to match applications will enter a golden age as real-world customer usage conditions will finally be taken fully into account.  Where design and selection was previously limited by the budget for a few build and break iterations, and low visibility of design options, they will soon be informed by an almost unlimited evaluation of all possibilities.  Where simulation methods have traditionally had greatest impact on product design functions, we will also start to see rubber part Digital Twins that track damage accumulation and create value in the operational functions of a business.  Durability is definitely set to become a strong arena for competition in the next 10 years.

 twitterlinkedinmail

Durability Simulation and the Value of Product Development Resources

Durability Simulation | Endurica

What value does your company gain by deploying product development resources one way vs. another when it comes to durability?

R&D organizations are built around what it takes to get the product into production.  The costs of the organization include wages for the engineers and technicians, the costs of the capital equipment used in development and testing, and the overhead from administrative functions.  These are all fixed costs, and in the rubber industry it is typical to see R&D budgets that amount to somewhere between 1% and 5% of sales.

The R&D program lifecycle is iterative.  It goes something like this: design, build, test, qualify for production, launch product.  A quick way to understand product development costs is to look at how long it takes for one design-build-test-launch iteration.  If it takes your tech center one year per iteration, then the cost of one pass through the cycle is something like (company annual sales) x (R&D rate per annual sales)/(number of parallel development programs executing at a given time in your tech center).  For a $2B company with a 2.5% research budget and 10 development programs in the works, this works out to $5M/iteration.

An overview of cost distribution using the build and break method

How much of this cost is burned on durability issues?  Potentially all of it, at least within any one given iteration.  At worst, a non-qualifying test result leads to a “back to the drawing board” restart of the iteration.  The durability tests required for qualification can only be made after the prototype is in hand, so a restart means the whole team ends up revisiting and reproducing to correct a failed iteration.  Over the long run, if your iteration failure rate is 1 in 5 iterations (20%), that means you are burning $5M x 20% = $1M per product.

How much of this cost can realistically be avoided?  The big opportunity lies in the fact that the old “build and break” paradigm does not immediately hold accountable design decisions that lead to poor durability, and it does not have enough band-width to allow for much optimization.  A “build and break” only plan is a plan for business failure.  Poor decisions are only tested and caught after big investments in the iteration have all become sunk costs.  The advent of simulation has fueled a new “right the first time” movement that empowers the engineer to very rapidly investigate and understand how alternative materials, alternative geometries, or alternative duty cycles impact durability.  The number of alternatives that can be evaluated and optimized by an analyst before committing other resources is many times greater.  “Right the first time” via simulation is a model that is increasingly favored by OEMs and suppliers because it works.  Expect to halve your iteration failure rate.twitterlinkedinmail

Wohler Curves or Fracture Mechanics?

Endurica uses a fracture mechanics based description of rubber’s fatigue behavior, rather than the classical Wohler curve (ie S-N curve) approach.  This is why:

1) Wohler curves in rubber show the combined effects of several nonlinear processes, but they do not easily deconvolve into useful information about the individual processes.  This means that Wohler curve users struggle to trace the causes of fatigue failures any deeper than the single monolithic empirical SN curve.  When the customer or the boss asks why the part is failing, Wohler curve users end up falling back on the old “rubber is mysterious” defense.  Meanwhile, users of critical plane analysis + fracture mechanics are hypothesis testing. They can check what events and what loading directions are most damaging, and what material parameters (crack precursor size, strain crystallization, threshold, crack growth rate law, thermal effects, etc.) can be exploited to gain leverage and solve the issue.

2) Fatigue failure in rubber is often dominated by “special effects”: dependence on strain level, dependence on R ratio, dependence on temperature, dependence on rate, dependence on ageing, etc. The Wohler curve crowd must choose between ignoring/oversimplifying these special effects, or running an experimental matrix that rapidly scales to an infeasibly huge size as more variables are added.  While fracture mechanics users obtain a wealth of information from a single test specimen (one test can probe many different strain levels, temperatures, rates, etc), Wohler curve users obtain 1 data point per tested specimen.  Look in the rubber technical literature and count the number of S-N-curves that are given, relative to the number of fatigue crack growth rate curves.  Google/scholar returns less than 2000 results for “rubber Wohler curve”, and 78700 results for “rubber crack growth curve”.  There is a reason that crack growth rate curves outnumber Wohler curves.

3) SN based methods are not conservative. Wohler curve users end up assuming that a crack will show up perpendicular to a max principal stress or strain direction.  This assumption only works when you have the very simplest loading cases, no compression, and no strain crystallization.  Users of fracture mechanics + critical plane analysis don’t worry about whether they have simple loading, finite straining,  out-of-phase loading, compressive loading, changing principal directions, and/or strain crystallization.  Critical plane analysis checks every possible way a crack might develop and is therefore assured to always find the worst case regardless of detailed mechanisms.

4) Wohler curves are messy. They depend strongly on crack precursor size, which naturally varies specimen-to-specimen, batch-to-batch, and between lab mix and factory processes.  During SN curve testing, the size of the crack is neither measured nor controlled.  This accounts for the extra scatter that is typical in these tests.  In fracture mechanics testing, on the other hand, the crack is measured and controlled, leading to more repeatable and reliable results.  Noisy data means that the Wohler curve crowd has trouble differentiating between material or design options.  Users of fracture mechanics benefit from cleaner results that allow more accurate discrimination with less replication.

A Wohler curve does have one valuable use.  The Wohler curve can be used to calibrate the crack precursor size for a fracture mechanics analysis. It only takes a few data points – not the entire curve, since the crack precursor size does not depend on strain level, or other “special effects” variables.  Our recommended practice is to run a small number of nucleation style tests for this purpose only, then leverage fracture mechanics to characterize the special effects.

The bottom line is that, for purposes of general fatigue life prediction in rubber, the Wohler curve method loses technically and economically to the fracture mechanics + critical plane analysis based method that is used in modern fatigue solvers.twitterlinkedinmail

Durability Simulation and the Value of Competitive Advantage

OEM - Supplier | Endurica Value of Competitive Advantage

Durability simulation is impacting product development business models in several big ways.  There are cost and risk avoidance impacts.  There is a time-to-market impact.  There is a quality/warranty impact.  And the biggest impact may be competitive advantage.  It’s certainly been in the news.

Rubber component suppliers must compete to win the business of Original Equipment Manufacturers (OEMs).  Having plant capacity is not enough.  The OEM also wants to know that the supplier can meet their durability spec.  The OEM wants to know that if there is a problem down the road, the supplier knows how to find it and fix it quickly.  It is a strong competitive advantage to be able to show the OEM a simulation of the component operating under their loads, along with fatigue calculations that support their warranty.

What is the value of this advantage?

Let’s assume that you are competing with 2 other suppliers for a contract worth $1M.  Since there are 3 competitors (including yourself), you can say that before award, the contract is, statistically speaking, only worth 1/3 of $1M to each competitor.  But at award, the winner takes all, and this means that 2/3 of the ultimate contract value depends completely on being the best option of the three.

This result can be generalized for any number n of competitors.  The fraction of the contract value that competitive advantage wins is (n-1)/n.  Using this rule, we see that for 2 competitors, 1/2 of the contract value comes from competitive advantage.  For 10 competitors, 9/10 comes from competitive advantage.  The more competitors you have, the more valuable it is to have an advantage.

  • How much of your new business win depends on being good with durability issues?
  • Are you the best at solving durability issues? (and do your clients know it!)
  • How much should you be investing in competitive advantage?

twitterlinkedinmail

close
Trial License RequestTrial License RequestTrial License RequestTrial License RequestTrial License Request

Our website uses cookies. By agreeing, you accept the use of cookies in accordance with our cookie policy.  Continued use of our website automatically accepts our terms. Privacy Center