Tolerances in Fatigue Life Prediction with Endurica

I get this question a lot: how well can the Endurica software predict fatigue life?  Is it as good as a metal fatigue code, where a factor of 2x is often quoted as a target tolerance?

The answer is yes, fatigue life predictions can reach and beat this level of accuracy. But as always, knowledge and control of the problem at hand is key.  We must keep in mind that fatigue behavior varies on a logarithmic scale.  It depends on many variables.  It depends on how failure is defined in the simulation and in the test.  Small variations of an input may lead to large variations of the fatigue life.  So, to achieve the best tolerances, careful specification, measurement, and control are required of both simulation and test.

Analysis tolerances depend on whether the analysis workflow is “open loop” or “closed loop”.  In an open loop workflow, the analyst is typically in the position of having to accept without question the as-given material properties, geometry, boundary conditions and load history.  The analysis is completed and reported.  Decisions are made and life goes on.  In a closed loop workflow, there are additional steps.  These include a careful review of differences between the test and the simulation, as well as identification and correction of any erroneous assumptions (about material properties, geometry, boundary conditions, and load history).

Open loop workflows produce larger tolerances.  Every situation is different, but do not expect tolerances tighter than perhaps a factor of 3x-10x in life, when working in open loop mode.  There is just too much sensitivity, too many variables, and too little control in this mode.  The open loop mode does have a few advantages though.  It takes less work, less time, less cost.  And it is often useful for ranking alternatives (ie A vs. B comparisons).

For high accuracy, a closed loop workflow is required.  It is rarely the case that initial assumptions are sufficiently error-free to support tight tolerances on fatigue life prediction.  Therefore, careful measurement and validation of material property inputs, part dimensions, load-deflection behavior, pre-stresses, etc. should be made.  Where gaps are found between test and simulation, appropriate amendments to the test and/or to the simulation should be adopted.  This approach yields high confidence in the simulation results, and good accuracy in fatigue life predictions.  We have seen users hit life predictions to better than a factor of 1.1x with this approach!  Although this approach requires more effort, it results in more complete mastery of part design, and it yields a much stronger starting position for subsequent products.

While “right the first time” engineering is possible with either open or closed loop, the closed loop approach benefits from progressive refinement of the analysis inputs and it ultimately gives the highest success rate.


twitterlinkedinmail

License Queueing

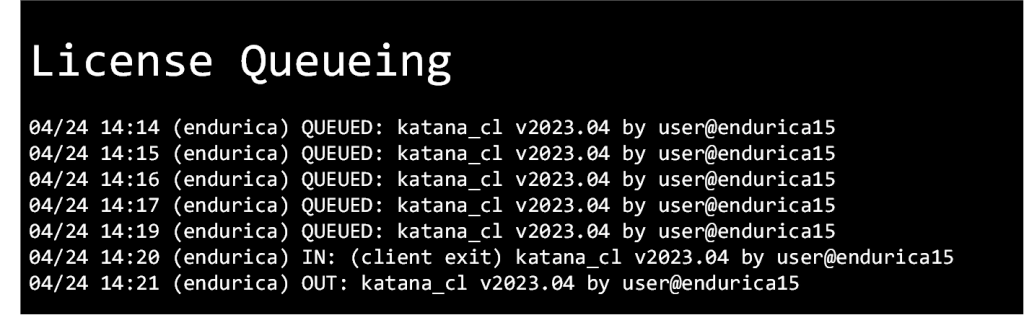
Design optimization studies are driving a need to support the efficient management and execution of many jobs.  This is why we are announcing that Endurica’s software license manager now supports queueing for licenses. This allows a submitted job to automatically wait to start until enough licenses are available, instead of the prior behavior of exiting with a license error. Now you can submit many jobs without worrying about license availability.

License queueing is only available for network licenses (not node-locked). It is currently supported for Katana CL/DT jobs and EIE jobs submitted from a command prompt.

To enable queueing, set the environment variable RLM_QUEUE to any value. This environment variable must be set on the client machine (not the license server).

To learn more about license queueing, search for “How to Queue for Licenses” in the RLM License Administration documentation here: https://www.reprisesoftware.com/RLM_License_Administration.pdf


twitterlinkedinmail

Use This One Simple Trick to Ensure Rubber Part Durability

We’ve just added a new output to the Endurica fatigue solver: Safety Factor.  This feature makes it simple to focus your analysis on whether cracks have the minimum energy required to grow. Safety Factor is a quick and inexpensive way to identity potential failure locations.  It minimizes the number of assumptions you need to defend, and it is backed by hard science.  You don’t need to measure or explain the many influences that together determine how fast cracks grow.  You don’t need lengthy materials characterization experiments that take days or weeks.  You do need to know your material’s Intrinsic Strength T0 (ie Fatigue Threshold) and its crack precursor size c0. The test takes about an hour using the Coesfeld Intrinsic Strength Analyser.

The Safety Factor S is computed as the ratio of T0 to the driving force T on a potential crack precursor.  If the value of the Safety Factor S = T0/T is greater than 1, it indicates the margin by which crack growth is avoided.  If S is less than 1, it indicates that crack growth is inevitable. The calculation of the Safety Factor includes a search for the most critical plane, as we do for our full fatigue life computations.

Although the Safety Factor can’t tell you how long a part will endure, it nevertheless does offer great utility.  You can make a contour plot showing the locations in your part where the Safety Factor is the lowest.  This is a quick and inexpensive way to identity potential failure locations.  You can make statements about the reserve capacity of your design that are easy to communicate and understand with a wide audience.

 A vibration isolation grommet operating under small displacement  A vibration isolation grommet operating under large displacement

The images above show a vibration isolation grommet operating under small (Safety Factor 2.6) and large displacements (Safety Factor 0.83).  Color contours indicate the Endurica-computed Safety Factor, and use the same scale for both images.  Large Safety Factors are shown in blue.  Safety Factors approaching 1 are shown in red.  Safety Factors smaller than 1 are indicated in black.  These results show that the grommet can be expected to operate indefinitely under the small displacements, but that large displacements will produce cracks at some point, in the regions colored black.

twitterlinkedinmail

Durability by Design on Any Budget

Durability by Design

So, you’ve got a tricky durability problem to solve, a budget, and a deadline.  Let’s look at a helpful framework for sorting which Endurica workflows you need.  In the grid below, each row represents a potential approach you can take.  The approaches are, in order of increasing complexity and cost, the Infinite Life approach, the Safe Life approach, the Damage Tolerant approach, and the Fail Safe approach.

Endurica Durability Workflows

The Infinite Life approach is by far the simplest approach.  Here, we say that damage will not be allowed at all.  All locations in the part must operate, at all times, below the fatigue limit (ie intrinsic strength) of the rubber.  The required material testing is minimal: we need only know the fatigue limit T0 and the crack precursor size c0.  We avoid the question of how long the part may last, and we focus on whether or not we can expect indefinite life.  We report a safety factor S indicating the relative margin (ie S = T0 / T) by which each potential failure location avoids crack development.  When S>1, we predict infinite life.  For S<=1, failure occurs in finite time and we must then go on to the next approach…

In the Safe Life approach, the chief concern is whether or not the part’s estimated finite life is adequate relative to the target life.  The material characterization now becomes more sophisticated.  We must quantify the various “special effects” that govern the crack growth rate law (strain crystallization, temperature, frequency, etc.).  We consider the specific load case(s), then compute and report the number of repeats that the part can endure.  If the estimated worst-case life is greater than the target life then we may say that the design is safe under the assumptions considered.  If not, then we may need to increase the part’s load capacity, or alternatively to decrease the applied loading to a safe level.  In critical situations, we may also consider implementing the next level…

The Damage Tolerant approach acknowledges that, whatever the reasons for damage, the risk of failure always exists and therefore should be actively monitored.  This approach monitors damage development via inspection and via tracking of accrued damage under actual loading history.  A standard nominal load case may be assumed for the purpose of computing a remaining residual life, given the actual loading history to date.  Changes in material properties due to cyclic softening or ageing may also be tracked and considered in computing forecasts of remaining life.

The Fail Safe approach takes for granted that failure is going to occur, and obliges the designer to implement measures that allow for this to happen safely.  This can take the form of a secondary / redundant load path that carries the load once the primary load path has failed.  It can take the form of a sacrificial weak link / “mechanical fuse” that prevents operation beyond safe limits.  It can take the form of a Digital Twin that monitors structural health, senses damage, and requests maintenance when critical damage occurs.

The last three columns of the grid show which Endurica fatigue solver workflows align with each design approach.  The Endurica solvers give you complete coverage of all approaches.  Whether you need a quick Infinite Life analysis of safety factors for a simple part, or deep analysis of Damage Tolerance or Fail Safety, or anything in-between, our solvers have just what you need to get durability right.

twitterlinkedinmail

Proper tear testing of elastomers: Why you should tear up the Die C tear test

Endurica Fatigue Ninja tearing rubber

I spent an interesting and rewarding part of my career helping to lead an elastomer technical college in Yanbu, Saudi Arabia. One of the rubber technology words that was challenging for the Saudis to say in English was ‘tear’. They initially pronounced it like the heteronym related to crying. It might be a stretch to say that tears will come to your eyes if you don’t get tear testing of elastomers right, but proper measurement of critical tearing energy (tear strength) is essential for effective materials development for durability.

The fatigue threshold (intrinsic strength; T0) is the lower limit of the fatigue crack growth curve shown in the figure below, and we recently reviewed this material parameter including the various measurement options.1 The upper limit is the tear strength, TC. If loads in your elastomer component are near or above TC, then it is not a fatigue problem anymore but rather a critical tearing issue with imminent product failure. It is therefore important to accurately characterize this durability performance characteristic of your materials.

General fatigue crack growth behavior of elastomers

Endurica uses the planar tension (pure shear) geometry for measuring TC in our Fatigue Property Mapping testing services due to the simple relationship between the strain energy density (W) and the energy release rate (tearing energy, T).2,3 The TC is equal to the W at tearing multiplied by the initial specimen height, h. You can see this geometry below along with other tear testing specimens employed in the rubber industry and specified in the ASTM standard.4

Comparison of the different durability tests one can conduct: the differences between Crack Nucleation Test and Tear and Crack Growth Tests.

We sometimes get questions from folks with technical backgrounds in metals or plastics about whether rubber tear properties will be different when tested in distinct testing modes (mode I, mode II, etc.). It turns out that the extensibility of rubber causes the deformation to be predominately tension in the tearing region, irrespective of how the crack is opened, such that TC values are similar for rubber evaluated in different testing modes.2,3 Therefore, trouser tear testing is an alternative to the planar tension testing, as long as any stretching of the legs is accounted for in the data analysis.3,5 With no stretching of the legs, TC is simply given by 2F/t where F is the measured force to propagate the tear and t is the thickness of the specimen. The factor of 2 is surprisingly omitted in the ASTM standard4 even though it is mentioned in the appendix. The image below shows how to convert the ASTM trouser tear strength to TC.

Trouser tear strength testing

A proper tear test includes an initial macroscopic cut/crack in the specimen. This is not the case for Die C tear described in the tear testing standard.4 Die C is thus not a tear test at all but rather is a crack nucleation experiment akin to normal tensile testing of rubber. Because the strange Die C geometry forces failure in a small region in the center of the specimen, it is actually less useful than tensile strength testing of a dumbbell sample which probes the entire gauge region. The Die C test can also have substantial experimental variability related to the sharpness of the die used to punch out the samples. Unfortunately, the Die C “tear” test is the most popular method in the rubber industry to (incorrectly) assess the tear strength of elastomers, and this reality was a key motivator for writing this post. We look forward to seeing the rubber industry shift away from the Die C test, and we hope that the information provided here will help in that path to #GetDurabilityRight. Click here to learn how intrinsic strength and tear strength can be measured quickly and accurately (0:42 video).

References

  1. Robertson, C.G.; Stoček, R.; Mars, W.V. The Fatigue Threshold of Rubber and its Characterization Using the Cutting Method. Advances in Polymer Science, Springer, Berlin, Heidelberg, 2020, pp. 1-27.
  2. Lake, G.J. Fatigue and Fracture of Elastomers. Rubber Chem. Technol. 1995, 68, 435-460.
  3. Rivlin, R.S.; Thomas, A.G. Rupture of rubber. I. Characteristic energy for tearing. J. Polym. Sci. 1953, 10, 291–318.
  4. Standard Test Method for Tear Strength of Conventional Vulcanized Rubber and Thermoplastic Elastomers. Designation: ASTM D 624-00, ASTM International, West Conshohocken, PA, USA, 2020; pp. 1-9.
  5. Mars, W.V.; Fatemi, A. A literature survey on fatigue analysis approaches for rubber. Int. J. Fatigue 2002, 24, 949–961.
twitterlinkedinmail

Keeping Your Secrets

Keeping your Secrets

The old saying “loose lips sink ships” is as true in product development as it is in war.  Maybe more so – while warships are heavily armored, intellectual property is never more secure than the least ethical person’s willingness and ability to misappropriate.  And the stakes have never been higher. Simulation software makes it easier than ever to document material properties, geometry, physics and functions of your next product.  So, collaborators can communicate design intentions more easily and more fully than ever before.  The downside?  It’s easier than ever for an adversary (or the next disgruntled employee) to walk out with your crown jewels!

This is why we’ve just implemented an encryption feature in the Endurica fatigue solvers.  Now you can password-protect sensitive information.  You control which information gets encrypted, and which stays as plain text.  You can share material property or load case definitions for use by collaborators without revealing private details in which you are heavily invested.

Here is a quick demo of how the new feature works.  Check it out.

One more way we are helping you to win on durability.

twitterlinkedinmail

It Isn’t Durable Unless It’s Reliable

Endurica for Reliability and Durability

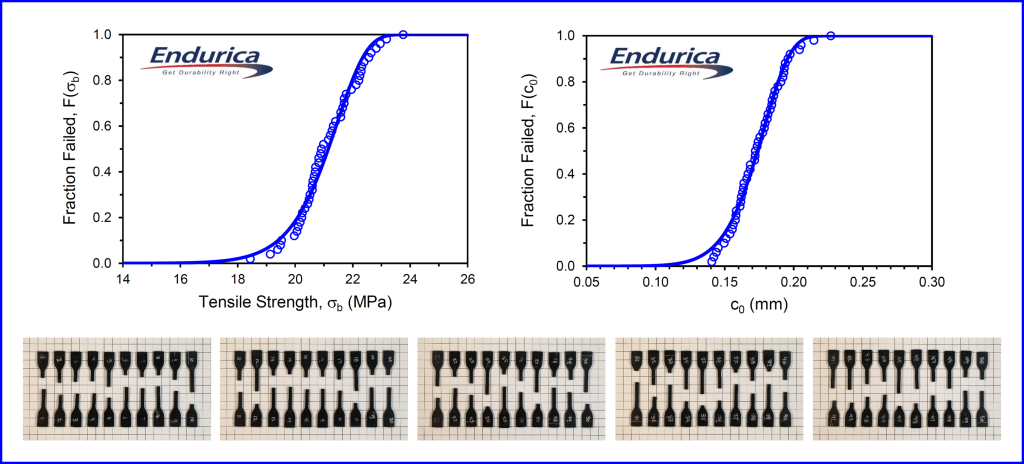
A brand promise of durability (i.e. fitness for service over a suitable period) doesn’t mean much unless it is delivered reliably (i.e. with high consistency).  When automakers provide a 100k mile warranty, for example, it is not enough to simply hit the promised life on average.  Falling short of the promised life should occur only very rarely, if at all.

What effort can be justified in pursuing reliability?  A quick way to estimate economic impact is to look at your product’s warranty adjustment rate.  If your manufacturing contract is worth $10 million dollars / year, and your customer returns 1% of the product for premature failures, then you have an opportunity to save $100k / year by eliminating premature failures.  This is a conservative estimate.  If your early failure rate is notably higher than your competition’s, for example, you may find yourself losing contracts or being forced into price concessions that aren’t sustainable.  A high failure rate may also result in legal liability for losses caused by your part.  In this sense, the total value in achieving reliability can actually approach or even exceed the value of your business!

So in design, consider not only the expected life of the most common crack precursor for your material (half of the samples in your population will have shorter life than this!), but consider also the life of the rare oversized crack precursor that occurs 1 time in 100, or 1 time in 1 million.  We recently launched a new Reliability Module to produce these statistics for exactly this purpose, check it out.  Think of it as a way to put a probability-based “safety factor” on fatigue life predictions.

twitterlinkedinmail

Solving the Durability Puzzle

Solve the Durability puzzle with EnduricaEver thought about what it takes to deliver the durability you expect from products you use? Durability reflects the combined sum of many decisions made all along the supply chain. What sources to use for raw materials? What dimensions and shape for product features? Are there OEM- or customer-imposed design constraints? What load cases occur in manufacturing, shipping, installation, and operation? Manufacturing processes? OEM-specified qualification and / or regulatory testing requirements? What is the warranty or brand promise? If these decisions are not made well, then durability (as well as cost and weight) will suffer.

The people making these decisions come from many backgrounds.  They are chemists, product engineers, testing engineers, structural analysts.  The big challenge is to organize things so that their contributions all add up to the desired end result: getting durability right, preferably on the first try.  It’s a big challenge because the domain expertise and tools in place today in many organizations were largely built before the science was ready and before the workflows were understood well enough to integrate across disciplines.  This situation can make it quite difficult to solve the durability puzzle.  The pieces don’t all fit together!

  • Oversimplified lab tests whose relationship to actual product use is doubtful
  • Fatigue testing instruments that produce noisy data, or execute with uncontrolled test duration
  • Raw materials suppliers struggling to relate chemistry and process improvements to actual impact on end products
  • Compounders making materials selection decisions based on insufficient / poor information
  • Product engineers missing opportunities to fully leverage material capacity
  • Outdated and inaccurate ‘rule of thumb’ engineering that doesn’t work on new cases
  • Incomplete simulation efforts that fail to forecast or diagnose key durability issues
  • Product qualification tests that under- or over-solicit damage or change failure modes
  • Part suppliers leaving OEMs with too little confidence that durability issues have been handled
  • OEMs and part suppliers struggling to account for actual end-use load cases

Endurica-powered workflows overcome these barriers.  Our training, testing services, testing instruments, and CAE software solutions integrate across disciplines.  Our motto is “Get Durability Right”.

Our classes are geared specifically for your compounders, test engineers, product engineers and analysts.  Your compounder doesn’t need to be a mechanical engineer, but she does need to negotiate the demands on the material.  Your product engineer and your analyst don’t need a PhD in chemistry, but they do need to push for performance that will win for the customer.  Your test engineer needs reliable, productive measurement strategies that get the key information that will power up your materials and product development efforts.  Our classes will pay for themselves many times over when your team confronts the next durability pitfall. 

Our testing services and testing instruments produce a complete picture of what limits durability in your application.  Rubber exhibits many ‘special effects’, and our tests are very useful for quantifying each effect, for building material models, and for solving and diagnosing durability issues.  We partner with leading labs around the world to bring you fast and reliable testing for durability simulation.  We partner with testing instrument maker Coesfeld to bring our protocols directly to your own lab with automated, user-friendly control, measurement and data reduction.  Analysts, designers and materials engineers all need clean, abundant, high-relevance measurements. 

Our software (Endurica CL, Endurica DT, Endurica EIE and fe-safe/Rubber) provides the most complete set of durability analysis capabilities in the world.  Total life, incremental damage, residual life, critical plane analysis, rainflow counting, nonlinear loads mapping, road load signal analysis, stiffness loss co-simulation, self-heating – its all here: documented, supported, validated, with examples and a large user-base.  We support the Abaqus, Ansys and MSC/Marc Finite Element solvers.  Use our software to see how different materials, different geometry, different load / use cases impact durability.  If your materials, product, analysis or testing people can ask the question, chances are that our tools will simulate it and give you new insights. 

Durability doesn’t have to be a difficult puzzle.  It costs way too much when people from different disciplines don’t “speak the same language” and try to go forward with conflicting ideas and tools.  Solve the puzzle by using pieces that fit together.  Get your team speaking Endurican!

Keywords: Compounding, Design, Testing, Analysis, Training

twitterlinkedinmail

Calibrating Crack Precursor Size in Endurica CL

Crack precursors exist in all elastomers owing to the heterogeneous microstructure, even before any loads are applied. The size of the typical precursor must be specified as part of the Endurica fatigue analysis workflow.  The best practice for finding the precursor size is to leverage both crack growth and crack nucleation experiments to enforce agreement between the nucleation test results and the corresponding simulation-predicted life results.  This procedure guarantees that both the crack growth and the crack nucleation experiments add up to an overall consistent story. 

Prior to performing the calibration, you will need to have already defined the hyperelastic law, and the fatigue crack growth rate law. Fatigue models used for rubber have the following parameters:

  • Relationship between tearing energy and crack growth rate
    • The parameters needed to define this relationship are obtained through fatigue crack growth experiments. The crack is loaded under a range of tearing energies while tracking growth of the crack. These tests obtain the critical tearing energy, Tc, which is the tearing energy at which the crack reaches end of life failure in one loading. The crack growth rate at critical tearing energy, rc, and the slope of the curve, F, are determined by fitting a power law to the experimental crack growth and tearing energy.
  • Threshold
    • This is the tearing energy limit T0 below which cracks do not grow. If you do not specify this parameter, then you will use the Thomas law. If you do specify this parameter, you will use the Lake-Lindley law.  The threshold can be measured using an Intrinsic Strength experiment.
  • Strain Crystallization
    • Some rubbers exhibit a strain crystallization behavior that causes an increase of durability under non-relaxing loads. If the duty cycle of your calibration experiment is nonrelaxing, and if you have a strain crystallizing material, then this characterization should be completed before calibrating the precursor size.  The strain crystallization effect is measured in the non-relaxing module.
  • End of life crack size
    • This parameter should be set in the material definition prior to calibrating the precursor size. A default value of 1mm is generally adequate, particularly when it turns out that the precursor size is at least 5x smaller than this value.  The part is considered to have failed when a crack reaches this size. 

The crack nucleation experiment used for the calibration procedure may be made on a material test coupon, or on an actual component.  Test coupons are convenient in early development stages as they do not require having a part to test.  So long as crack precursor size is controlled by intrinsic features of the compound recipe (and not by the extrinsic features of post-mixing processes), a test coupon is likely to give useful results.  There is a risk when using a test coupon: the risk that the precursor size in a manufactured part is actually controlled by some feature of post-mixing process such as factory contamination, part molding, abrasion, etc.  This risk can be mitigated by calibrating precursor size on the basis of crack nucleation experiments on the finished part.  In the following example, we show the process for calibration based on a finished part.  The process for a test coupon is the same, but the model of the part is replaced by a model of the specimen. 

To illustrate, take the case of a rubber bumper spring. Its duty cycle consists of compressing the 150 mm long rubber spring by 80 mm. Experiments show a fatigue life of 282,534 cycles for this duty cycle. A finite element analysis of the rubber spring is made to obtain strain history. The rubber spring is shown in the image below at the initial condition, at 50% of the displacement, and at 100% of the displacement during the fatigue duty cycle.

The rubber spring at the initial condition, at 50% of the displacement, and at 100% of the displacement during the fatigue duty cycle


We are now ready to calibrate the as yet unknown precursor size to the known experimental fatigue test result of the spring. The precursor size can be calibrated by calculating the fatigue life for a series of precursor sizes and then interpolating to find the one precursor size that results in the best agreement between fatigue life calculations and the experimental fatigue life. Use the PRECURSORSIZE_CALIBRATION output request in Endurica CL to produce a table of fatigue life vs. crack precursor size. Your output request syntax will look something like this:

**OUTPUT

PRECURSORSIZE_CALIBRATION, NFS=25, FSMIN=1e-2
LIFE

NFS is the number of precursor sizes to evaluate, in this case 25.  FSMIN is the smallest precursor size to evaluate, in this case 0.01 mm. 

Once you’ve executed the calibration, use the new Endurica Viewer to complete the calibration workflow. It can plot a wide range of Endurica analysis outputs including precursor size calibration. Just open the Endurica output file containing the calibration results and expand the output file contents tree to find the Precursor Size Calibration results.  The viewer then plots the computed table of precursor size vs fatigue life.

The viewer plots the computed table of precursor size vs fatigue life


If you click on the plot options in the upper left corner, you can input the target life and the viewer will interpolate the precursor size. In this case, for a life of 282,534 cycles, the corresponding precursor size is 39 microns. Now that the precursor size is calibrated, the spring geometry can be optimized, different loadings analyzed, or entirely different parts can be analyzed using the material model to get fatigue life results that accurately reflect the precursor size that is most representative of the final material in the part. Again, if a part is not available, precursor size can also be calibrated to fatigue results from standard simple tension test specimen.

The calibrated rubber spring FE model with the life result of 282,534 cycles is shown below.

The calibrated rubber spring FE model with the life result of 282,534 cycles is shown below.

twitterlinkedinmail

Behind the Scenes Tour of Endurica Software Development and QA Practices

Ever wonder what it takes to consistently deliver quality and reliability in our software releases?  Here’s a brief overview of the systems and disciplines we use to ensure that our users receive timely, trouble-free updates of Endurica software.

Automation:

Throughout the life of our software, changes are made to our source code for a variety of reasons.  Most commonly, we are adding new features and capabilities to our software.  We also make updates to the code to improve performance and to squash the inevitable bugs that occasionally occur.

With each change committed to the code repository, the software needs to be built, tested, and released.  Endurica’s workflow automates these steps so that any change to the source repository triggers a clean build of the software.  A successful build is automatically followed by a testing phase where our suite of benchmarks is executed and compared to known results.  Finally, the build is automatically packaged and stored so that it is ready to be delivered.  At each step along the way, a build error or failed test will cancel the workflow and send an alert warning that the release has been rejected, so that the issue can be addressed, and the workflow restarted.

Endurica's build and testing process ensures that high quality standards are met for every new release. Black arrow: normal flow, Red arrow: an error or failed test
Figure 1: Endurica’s build and testing process ensures that high quality standards are met for every new release. Black arrow: normal flow, Red arrow: an error or failed test.

Reliability:

The automated testing phase that every release goes through helps ensure the reliability of our software.  For example, every Endurica CL release must pass all 70 benchmarks.  Each benchmark is a separate Endurica CL analysis made up of different materials, histories, and output requests.  Results from a new build are compared to known results from the previous successful build.  If results do not agree, or if there are any errors, the benchmark does not pass and the build is rejected.

The testing phase prevents “would-be” bugs from making it into a release and makes sure that any issues get resolved.

Repeatability:

The automated nature of our development workflow naturally helps with repeatability in our releases.  Each build flows through the same pipeline, creating consistent releases every time.  There is less worry, for example, that a component will be forgotten to be included.  It also allows us to recreate previous versions if comparisons need to be made.

Traceability:

Our version control system enables us to easily pinpoint where and when prior changes were introduced into the software.  Each release is tied to a commit in the repository. This allows any future issues to be easily traced back and isolated to a small set of changes in the source for quick resolution.

Responsiveness:

Automating the build and release pipelines greatly increases our responsiveness.  If an issue is discovered in a release, the problem can be resolved, and a fully corrected and tested release can be made available the same day.  We can also quickly respond to user feedback and suggestions by making small and frequent updates.

The systems and disciplines we use in our development process make us very efficient, and they protect against many errors. This means we can spend more of our time on what matters: delivering and improving software that meets high standards and helps you to get durability right.twitterlinkedinmail

close
Trial License RequestTrial License RequestTrial License RequestTrial License RequestTrial License Request

Our website uses cookies. By agreeing, you accept the use of cookies in accordance with our cookie policy.  Continued use of our website automatically accepts our terms. Privacy Center