User Requests and New Features: You Asked For It, You Got It

You asked for it, Endurica gives you new features!Once a year, we ask our users to weigh in on what we can do to further improve your experiences with the Endurica fatigue solvers.  The feedback helps us aim our development at bringing you winning capabilities.  It is also a marker we can use to gauge progress.

Here are the survey results from 2020:

Results from consumer survey stating which products they are most likely to use. Results from consumer survey stating which products they are most likely to use.

How did we do this year?  Check it out:

Support for additional channels in Endurica’s Efficient Interpolation Engine (EIE).  EIE makes it possible to compute strain histories and fatigue life from lengthy road load signals. To date, EIE has supported up to 3 independent load channels.  But we’ve had several of our best users tell us they need 6 channels.  The expanded capability was a big focus for development this year, and now it is complete and nearly ready for launch.  Stay tuned for more details to come out in early 2022.

Safety Factor.  The Safety Factor calculation is a feature of Endurica’s new Katana CL that launched this year.  It avoids the need for full characterization of the crack growth rate law but gives you the benefits of critical plane analysis. Given only the intrinsic strength (fatigue threshold) and precursor size, it calculates the margin by which the most critical loads remain below your material’s fatigue limit.  It tells you whether you may expect indefinite life (or not). Use it with the Intrinsic Strength Analyser experiment.  Perfect for analysis projects where you need to demonstrate capacity for long life with limited timeline or budget.

UHYPER.  Abaqus users can now define their own hyperelastic law in Endurica.  The Endurica UHYPER interface matches the UHYPER Abaqus interface so that you can use the same subroutine with both codes.

Linux Support.  Did you know that the Endurica solvers are available on both Windows and Linux?  Our Linux users can now run the entire Endurica suite of software (CL, DT, and EIE) on their systems.

Execution Speed.  The recently launched Katana solver (for CL and DT licenses) offers unprecedented speed.  Our benchmarks show that on a single thread, users will cut run times by more than ½.  And the Katana solver also offers multithreading.  Our benchmarks showed excellent scaling behavior up to >40 parallel threads.  These capabilities means that users will be able to run much larger jobs, and to complete their existing jobs with much shorter run times.

Improved hfi syntax / error checking.  Another feature of the Katana solver is its adoption of the json format for the input file.  The switch to the widely adopted json standard means that our solutions are now much easier to script via python or matlab and that there are file editors which automatically do the syntax / error checking.

Cosimulation Interface for Ansys.  The cosimulation capability of Endurica DT updates the finite element solution so that material property evolution can be simulated.  It has previously only been available to Abaqus users, but has now been developed for Ansys.  It is currently being beta tested.  We expect to launch this addition in Q1 2022. This means that Ansys users will very soon be able to make full use of Endurica DT’s Cyclic Softening modules and Ageing Workflow.

Materials database expansion.  The next Endurica release will have an addition to the materials database: a series of six HNBRs. We are also preparing to release the database in several common unit systems, rather than the prior single unit system.

With 2021 behind us now, its time to look forward to 2022 (and beyond!).  Look for the client survey and let us know how to best serve your upcoming needs.

twitterlinkedinmail

Use This One Simple Trick to Ensure Rubber Part Durability

We’ve just added a new output to the Endurica fatigue solver: Safety Factor.  This feature makes it simple to focus your analysis on whether cracks have the minimum energy required to grow. Safety Factor is a quick and inexpensive way to identity potential failure locations.  It minimizes the number of assumptions you need to defend, and it is backed by hard science.  You don’t need to measure or explain the many influences that together determine how fast cracks grow.  You don’t need lengthy materials characterization experiments that take days or weeks.  You do need to know your material’s Intrinsic Strength T0 (ie Fatigue Threshold) and its crack precursor size c0. The test takes about an hour using the Coesfeld Intrinsic Strength Analyser.

The Safety Factor S is computed as the ratio of T0 to the driving force T on a potential crack precursor.  If the value of the Safety Factor S = T0/T is greater than 1, it indicates the margin by which crack growth is avoided.  If S is less than 1, it indicates that crack growth is inevitable. The calculation of the Safety Factor includes a search for the most critical plane, as we do for our full fatigue life computations.

Although the Safety Factor can’t tell you how long a part will endure, it nevertheless does offer great utility.  You can make a contour plot showing the locations in your part where the Safety Factor is the lowest.  This is a quick and inexpensive way to identity potential failure locations.  You can make statements about the reserve capacity of your design that are easy to communicate and understand with a wide audience.

 A vibration isolation grommet operating under small displacement  A vibration isolation grommet operating under large displacement

The images above show a vibration isolation grommet operating under small (Safety Factor 2.6) and large displacements (Safety Factor 0.83).  Color contours indicate the Endurica-computed Safety Factor, and use the same scale for both images.  Large Safety Factors are shown in blue.  Safety Factors approaching 1 are shown in red.  Safety Factors smaller than 1 are indicated in black.  These results show that the grommet can be expected to operate indefinitely under the small displacements, but that large displacements will produce cracks at some point, in the regions colored black.

twitterlinkedinmail

Things that went right in 2020 at Endurica

Things that went right in 2020 at Endurica

2020 is burned in all our minds as a chaotic and tough year.  Just like the rest of the world, Endurica staff experienced times of isolation and loss due to the pandemic.  On a positive note, we invested heavily in making our tools and workflows better than ever so that we’re ready to come back strong in 2021.  Here is a list of our top new developments in 2020:

Endurica Software Enhancements

  • Endurica DT’s new Ageing Feature now enables you to simulate how ageing affects your rubber product. Your compound’s stiffness, strength, and fatigue properties can all evolve with time.
  • Our new Linux distribution takes our solutions beyond the Windows world.
  • We’ve added an encryption feature to safeguard your trade secrets.
  • Viewer Improvements make it easier than ever to visualize your fatigue simulation results.
  • EIE Enhancements give you blazing-fast compute speed for full road-load signals.
  • We’ve also planned an aggressive development agenda for 2021. Stay tuned for a new Endurica-based smartphone app for materials engineers, for a new feature that computes fatigue threshold safety margins, for a new block cycle schedule extraction algorithm, and more!

Training

  • The new Fatigue Ninja Friday webinar series provides step-by-step application training for key the workflows that you need to get durability right. All of the recorded episodes are now available in the online Endurica academy.
  • The new Winning on Durability webinar series provides high-level overviews of both technical and business topics so you can connect Endurica tools to your strategic imperatives. All of these recorded webinars are available gratis on our website.
  • We’ve recast our in-person training events as LIVE, ONLINE workshops accessible safely around the world.

Testing Instruments

Fatigue Property Mapping Testing Service

  • We added the Reliability Module to our Fatigue Property Mapping testing service. Use it to quantify crack precursor size statistics when you need to estimate probability of failure.
  • We also reorganized the Thermal Module and the Ageing Module into Basic and Advanced levels, to offer a lower price-point when a basic option will suffice.

Want to leverage any of these new capabilities in your next durability project?  Give us a call and let’s talk!

twitterlinkedinmail

Does hydrostatic loading cause fatigue damage in rubber?

Hydrostatic

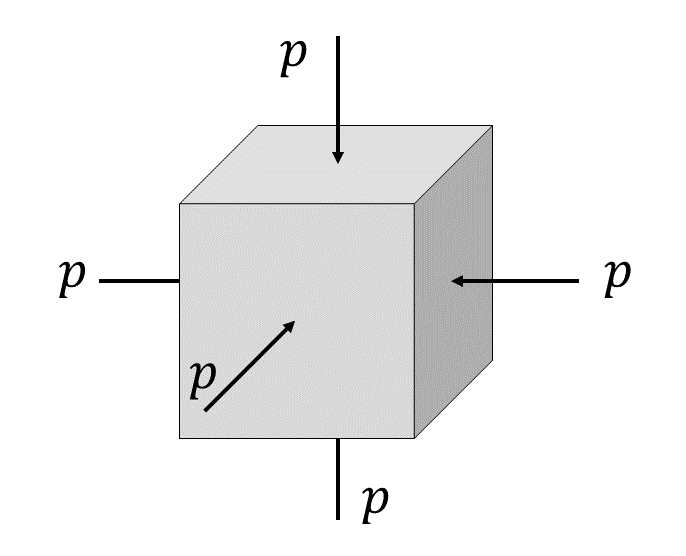
A question was recently put to us regarding the effects of cyclic hydrostatic loading on rubber.  In hydrostatic loading, no shearing stresses are present, and the 3 principal stresses all have the same value p.  For this case, all 3 Mohr’s circles degenerate to a single point on the normal stress axis.

 Mohr’s circles degenerate to a single point for the case of compressive hydrostatic pressure.

Figure 1. Mohr’s circles degenerate to single point for the case of compressive hydrostatic pressure.

Under dynamic hydrostatic loading, the point may move along the normal stress axis in either of the tensile (p>0) or compressive directions (p<0).  When we have pure hydrostatic compression, cracks in all orientations are closed with a tearing energy of zero.  We expect infinite fatigue life in this case.  On the other hand, when we have hydrostatic tension, growth of a crack will release energy, and so the tearing energy is positive. We then expect crack growth to occur at a rate determined by the tearing energy.  Endurica estimates tearing energy T via the following rule:

T = 2 πWC a

in which a is the size of the crack, and Wc is the cracking energy density. For a slightly compressible material under hydrostatic loading, the cracking energy density calculation becomes

WC = ∫ pd ε 𝜀

and, remembering that for volumetric deformation, the linear strain is 1/3 of the volumetric dilatation, we finally obtain

WC = 1/3 ∫ pd ε v = 1/3 W

where W is the dilatational strain energy density.


So let’s compute an example using the following material definition:

 Computation using different materials

Let’s compute 8 different fully relaxing hydrostatic loading cases: 4 in hydrostatic compression, 4 in hydrostatic tension.  We’ll take these loaded extreme strain levels: -10%, -5%, -2%, -1%, 1%, 2%, 5%, 10%, which correspond to extreme dilatations of -27%, -14%, -6%, -3%, 3%, 6%, 16%, 33%.

As a first check, we plot the hydrostatic pressures computed for each case.  The slope of the line is 3000 MPa, which agrees with the assigned bulk modulus.

 Plot of the hydrostatic pressures computed for each case

Figure 2. Computed volume strain – hydrostatic pressure relationship.

Next, we compute the strain energy density and the cracking energy density for each case.  As expected, we verify that for p<0, crack closure results in CED=0, and for p>0, CED=SED/3.

Comparison of strain energy density and cracking energy density for hydrostatic compression and tension.

Figure 3. Comparison of strain energy density and cracking energy density for hydrostatic compression and tension.

Finally, we compute the fatigue life for each case.  In all cases, we see that the damage sphere is uniform over its entire surface, indicating that all possible crack orientations receive equal damage.  We also see that for cases involving hydrostatic compression, life is essentially infinite.  For cases involving hydrostatic tension, we verify that finite life is predicted, with shorter life at higher hydrostatic tension, as expected.

 Predicted life and damage sphere for compressive and tensile hydrostatic loading.

Figure 4.  Predicted life and damage sphere for compressive and tensile hydrostatic loading.

In summary, we have verified that the Endurica fatigue solver behaves as follows with respect to hydrostatic loading:

  • In hydrostatic compression, no damage accrues, and life is indefinite.
  • In hydrostatic tension, crack growth is predicted, with shorter fatigue life for higher values of tension. The cracking energy density is 1/3 of the strain energy density for hydrostatic tension.
  • For all hydrostatic cases, there is no single preferred critical plane. Rather, all planes show equal potential for crack development.
twitterlinkedinmail

Durability Insights from the ISA for Tire Tread Compound Development

My last blog post (Getting a Quick Read on Durability with the Intrinsic Strength Analyser) highlighted a one-hour test on the Intrinsic Strength Analyser (ISA) to screen elastomer materials for long-term fatigue performance, with applications in materials R&D and plant mixing quality control. To illustrate the use of this approach for rubber compound development, we recently had the opportunity to collaborate with Dr. Nihat Isitman from Goodyear Tire & Rubber Company in Akron, Ohio and Dr. Radek Stoček from Polymer Research Laboratory in Zlín, Czech Republic.1 Dr. Isitman led this project and was scheduled to present our research at the Spring 2020 Technical Meeting of the ACS Rubber Division, but the meeting was cancelled due to COVID-19 precautions. Instead, the Rubber Division is offering the content online, and the meeting presentations are available here for a modest fee.

Our study considered model tread compounds based on the well-known green tire formulation, which is a compatible blend of solution styrene-butadiene rubber (SBR) and high-cis butadiene rubber (BR) that is reinforced with a silica-silane system for low rolling resistance (improved fuel economy) passenger tires. Additional production compounds used in actual tire treads were also tested, but the proprietary results for these materials were not included in the public presentation. The SBR/BR ratio, silica loading, and crosslink density were all varied in this investigation. For each rubber formulation, the ISA was used to measure the fatigue threshold (T0) and critical tearing energy (tear strength; Tc), which bracket the two ends of the fatigue crack growth curve as shown below.

 Intrinsic strength and tear strength

The established cutting method of Lake and Yeoh2,3 is used for assessing T0 on the ISA, and the one-hour test on this benchtop instrument is concluded with a tearing procedure to measure Tc. The ISA is manufactured by Coesfeld GmbH & Co. in Dortmund, Germany, and distributed in the Americas by Endurica LLC (see photo).

The Intrinsic Strength Analyser manufactured by Coesfeld GmbH & Co. in Dortmund, Germany, and distributed in the Americas by Endurica LLC

The slide image below summarizes the key findings of this research collaboration. Optimization of T0 and Tc is possible thanks to different sensitivities to the various compounding variables. It is important to measure both fatigue threshold and tear strength to quantify durability potential of rubber materials, and the ISA is an efficient and effective instrument for these measurements. To learn more about this testing equipment for the rubber lab, please visit our Instruments page and contact us at info@endurica.com with questions.

 Summary of key findings of this research collaboration

References

  1. N. Isitman, R. Stoček, and C. G. Robertson, “Influences of compounding attributes on intrinsic strength and tearing behavior of model tread rubber compounds”, paper scheduled to be presented at the 197th Technical Meeting of the Rubber Division, ACS, Independence, OH, April 28-30, 2020 (online presentation due to meeting cancellation).
  2. G. J. Lake and O. H. Yeoh, “Measurement of Rubber Cutting Resistance in the Absence of Friction”, International Journal of Fracture 14, 509 (1978).
  3. C. G. Robertson, R. Stoček, C. Kipscholl, and W. V. Mars, “Characterizing the Intrinsic Strength (Fatigue Threshold) of Natural Rubber/Butadiene Rubber Blends”, Tire Sci. Technol. 47, 292 (2019).
twitterlinkedinmail

Calibrating Crack Precursor Size in Endurica CL

Crack precursors exist in all elastomers owing to the heterogeneous microstructure, even before any loads are applied. The size of the typical precursor must be specified as part of the Endurica fatigue analysis workflow.  The best practice for finding the precursor size is to leverage both crack growth and crack nucleation experiments to enforce agreement between the nucleation test results and the corresponding simulation-predicted life results.  This procedure guarantees that both the crack growth and the crack nucleation experiments add up to an overall consistent story. 

Prior to performing the calibration, you will need to have already defined the hyperelastic law, and the fatigue crack growth rate law. Fatigue models used for rubber have the following parameters:

  • Relationship between tearing energy and crack growth rate
    • The parameters needed to define this relationship are obtained through fatigue crack growth experiments. The crack is loaded under a range of tearing energies while tracking growth of the crack. These tests obtain the critical tearing energy, Tc, which is the tearing energy at which the crack reaches end of life failure in one loading. The crack growth rate at critical tearing energy, rc, and the slope of the curve, F, are determined by fitting a power law to the experimental crack growth and tearing energy.
  • Threshold
    • This is the tearing energy limit T0 below which cracks do not grow. If you do not specify this parameter, then you will use the Thomas law. If you do specify this parameter, you will use the Lake-Lindley law.  The threshold can be measured using an Intrinsic Strength experiment.
  • Strain Crystallization
    • Some rubbers exhibit a strain crystallization behavior that causes an increase of durability under non-relaxing loads. If the duty cycle of your calibration experiment is nonrelaxing, and if you have a strain crystallizing material, then this characterization should be completed before calibrating the precursor size.  The strain crystallization effect is measured in the non-relaxing module.
  • End of life crack size
    • This parameter should be set in the material definition prior to calibrating the precursor size. A default value of 1mm is generally adequate, particularly when it turns out that the precursor size is at least 5x smaller than this value.  The part is considered to have failed when a crack reaches this size. 

The crack nucleation experiment used for the calibration procedure may be made on a material test coupon, or on an actual component.  Test coupons are convenient in early development stages as they do not require having a part to test.  So long as crack precursor size is controlled by intrinsic features of the compound recipe (and not by the extrinsic features of post-mixing processes), a test coupon is likely to give useful results.  There is a risk when using a test coupon: the risk that the precursor size in a manufactured part is actually controlled by some feature of post-mixing process such as factory contamination, part molding, abrasion, etc.  This risk can be mitigated by calibrating precursor size on the basis of crack nucleation experiments on the finished part.  In the following example, we show the process for calibration based on a finished part.  The process for a test coupon is the same, but the model of the part is replaced by a model of the specimen. 

To illustrate, take the case of a rubber bumper spring. Its duty cycle consists of compressing the 150 mm long rubber spring by 80 mm. Experiments show a fatigue life of 282,534 cycles for this duty cycle. A finite element analysis of the rubber spring is made to obtain strain history. The rubber spring is shown in the image below at the initial condition, at 50% of the displacement, and at 100% of the displacement during the fatigue duty cycle.

The rubber spring at the initial condition, at 50% of the displacement, and at 100% of the displacement during the fatigue duty cycle


We are now ready to calibrate the as yet unknown precursor size to the known experimental fatigue test result of the spring. The precursor size can be calibrated by calculating the fatigue life for a series of precursor sizes and then interpolating to find the one precursor size that results in the best agreement between fatigue life calculations and the experimental fatigue life. Use the PRECURSORSIZE_CALIBRATION output request in Endurica CL to produce a table of fatigue life vs. crack precursor size. Your output request syntax will look something like this:

**OUTPUT

PRECURSORSIZE_CALIBRATION, NFS=25, FSMIN=1e-2
LIFE

NFS is the number of precursor sizes to evaluate, in this case 25.  FSMIN is the smallest precursor size to evaluate, in this case 0.01 mm. 

Once you’ve executed the calibration, use the new Endurica Viewer to complete the calibration workflow. It can plot a wide range of Endurica analysis outputs including precursor size calibration. Just open the Endurica output file containing the calibration results and expand the output file contents tree to find the Precursor Size Calibration results.  The viewer then plots the computed table of precursor size vs fatigue life.

The viewer plots the computed table of precursor size vs fatigue life


If you click on the plot options in the upper left corner, you can input the target life and the viewer will interpolate the precursor size. In this case, for a life of 282,534 cycles, the corresponding precursor size is 39 microns. Now that the precursor size is calibrated, the spring geometry can be optimized, different loadings analyzed, or entirely different parts can be analyzed using the material model to get fatigue life results that accurately reflect the precursor size that is most representative of the final material in the part. Again, if a part is not available, precursor size can also be calibrated to fatigue results from standard simple tension test specimen.

The calibrated rubber spring FE model with the life result of 282,534 cycles is shown below.

The calibrated rubber spring FE model with the life result of 282,534 cycles is shown below.

twitterlinkedinmail

Just Because You Can Doesn’t Mean You Should

Build it or Buy It | Endurica - Get Durability RightWhen you have an unmet simulation or testing need, should you build or buy the capability?

There are testing instruments and software packages available in the market – which have been improved through years of R&D and quality management – that can meet the needs of a technical team in their product development efforts. Despite these turn-key resources, we sometimes see a company tasking some of its engineers to build their own.

Why does this happen?

Companies hire smart and creative engineers and scientists with advanced degrees to populate their R&D centers. It is common, and even expected in many situations, for a graduate student to create customized equipment or software as a part of a Ph.D. or M.S. research project. Pushing the boundaries of science and technology often requires such development of devices or code. Also, limited research funding in academia can force students to build their own equipment. When young engineers start their industrial careers after graduate school, they carry with them the mindset of building and programming things themselves. These individuals excitedly offer to create when a new analysis or measurement need arises within a company, and managers like to encourage the enthusiasm of their technical staff.

But, even if your sharp engineer can build a DIY testing device or computer program that recreates the state-of-the-art commercial products created by teams of engineers across many years, is this an efficient and strategic use of the engineer’s abilities? If your company makes tires, for example, then shouldn’t you have your smart people focused on making better tires rather than making testing instruments or software?  What are the labor costs, and the opportunity costs, of your highly-skilled engineer building a piece of testing equipment compared to the price of the commercial instrument or relative to the return you could make on an actual improvement to your product? Unless you are in a position to surpass the commercial solution, there is no competitive advantage in the DIY solution. Once you have created your own solution, who will maintain and support it? Will you be able to keep it up to date with advances in technology? Do you have the capabilities and resources to validate your solution more strongly than the market has already validated the commercial solution?

Unless you are Anakin Skywalker, DIY is not always a winning strategy

Through my 15 years of experience in materials research and development in the tire and rubber industry, I have seen several pieces of home-built testing equipment collecting dust within companies. Either they were half finished and abandoned or could only be reliably operated by the creator who moved to another department or company.

There can be circumstances where the needed instrument or simulation product is not commercially available. Sometimes the capability exists in the marketplace, but it is not discovered because the maker mindset leads to a halfhearted search. For customized solutions, you may consider working with a vendor to leverage their expertise in creating the required device or program.

If your analysis and testing needs are in the rubber fatigue and lifetime area, please talk to us before you decide to invest in creating your own solutions. Our solutions embody decades of experience. They are the most competitive and strongly validated solutions you can buy. Endurica has specialized finite element analysis software that predicts elastomer durability for complex geometries and loads, and we offer testing instruments for accurately characterizing the fracture mechanics of elastomers through our partnership with Coesfeld GmbH & Co. KG. We can take you quickly to the forefront of fatigue management capabilities.

 twitterlinkedinmail

Welcome to the Endurica Blog

Welcome to the Endurica blog, written by founder William Mars, Ph.D. These earlier posts (AND MANY MORE) are available on Will’s LinkedIn page:


Computing tire simulation to determine rubber durability and fatigue life

Tire Society 2016: Notes on Advances in Computing Durability –  September 22, 2016


Graph showing strain crystallization and durability of elastomers with variables of strain amplitude and mean strain

Strain Crystallization and Durability of Elastomers – August 26, 2016


Rough sketch of maximum principal stress damage on an Endurica notepad

Maximum Principal Stress Damage – August 3, 2016


Image of a microstructure in Elastomers

Microstructure in Elastomers: Flaw or Feature? – March 26, 2016

twitterlinkedinmail

close
Trial License RequestTrial License RequestTrial License RequestTrial License RequestTrial License Request

Our website uses cookies. By agreeing, you accept the use of cookies in accordance with our cookie policy.  Continued use of our website automatically accepts our terms. Privacy Center