
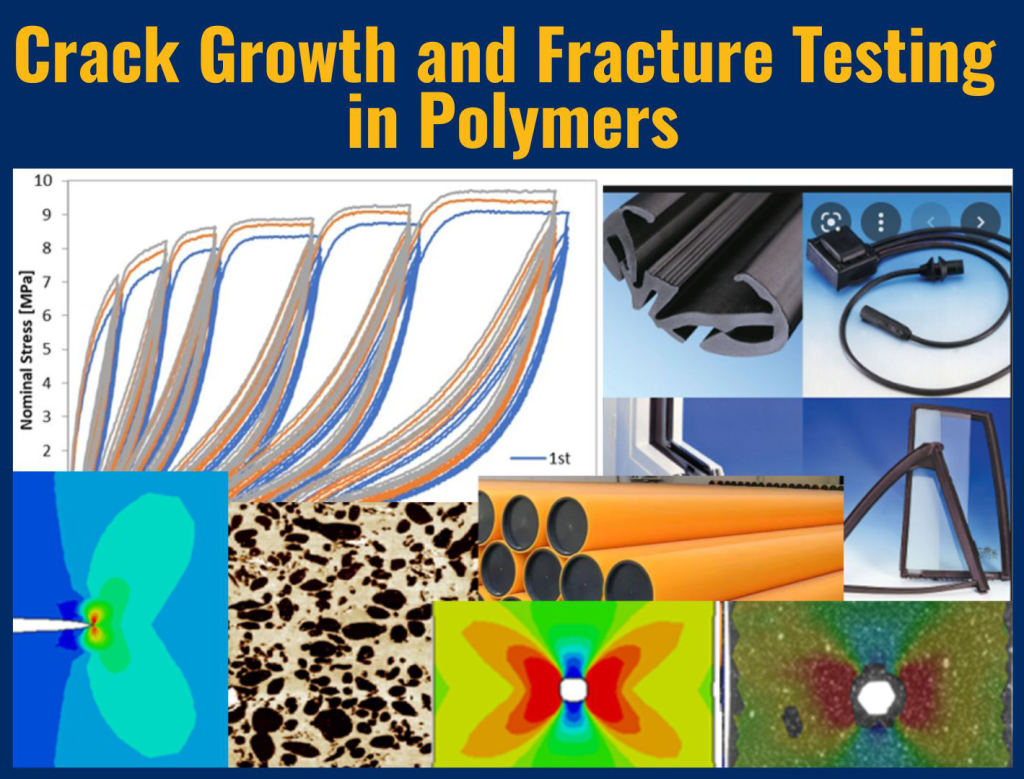
My PhD work at the University of Wisconsin was on crack growth in high density, high molecular weight polyethylene (HDHMWPE) used in natural gas distribution... Continue reading
Return to previous page
Category: Materials Characterization

All materials are temperature dependent, but some more than others: metals tend to be crystalline solids and will melt at sufficiently high temperatures; in contrast,... Continue reading

Wow – this year has really been one of many firsts for Endurica. We had our first ever Community Conference in April, we started our... Continue reading

The load cases to be considered in fatigue analysis can be very lengthy and can involve multiple load axes. Often, load cases are much longer... Continue reading
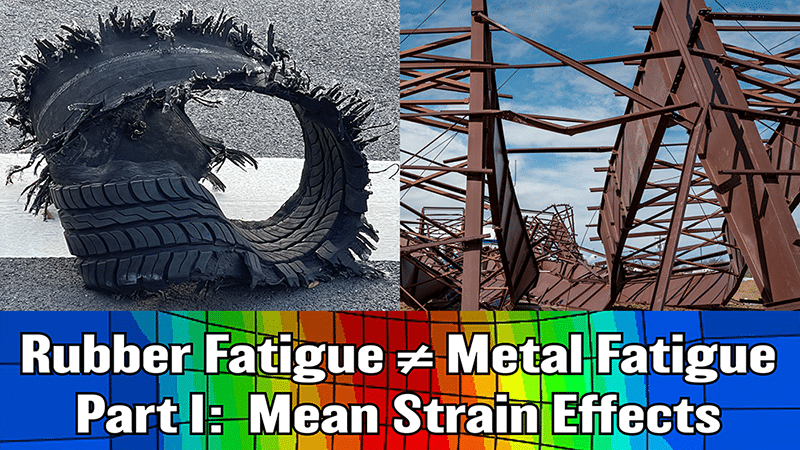
Rubber and metal are very different materials that exhibit very different behaviors. Consider the effect of mean strain or stress on the fatigue performance of... Continue reading
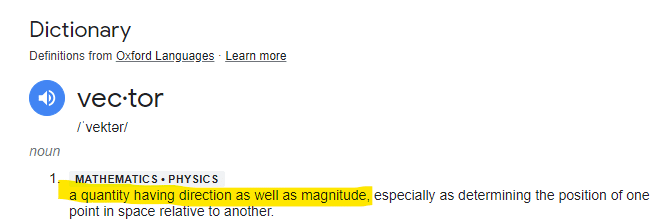
2023 marked year 15 for Endurica. If I had to pick one word to describe the past year, that word would be “vector”. Because magnitude... Continue reading
Crystallization requires the suppression of molecular mobility, which in natural rubber can happen either by reducing the temperature or by increasing the strain. Crystallization of... Continue reading
How do you respond to the call for sustainable solutions in the rubber industry? Is it via bio-sourced polymers or fillers? elimination of carcinogenic additives... Continue reading
Rubber can be formulated in a very wide range of properties. For materials developers, this cuts two ways. On one hand, it means that... Continue reading