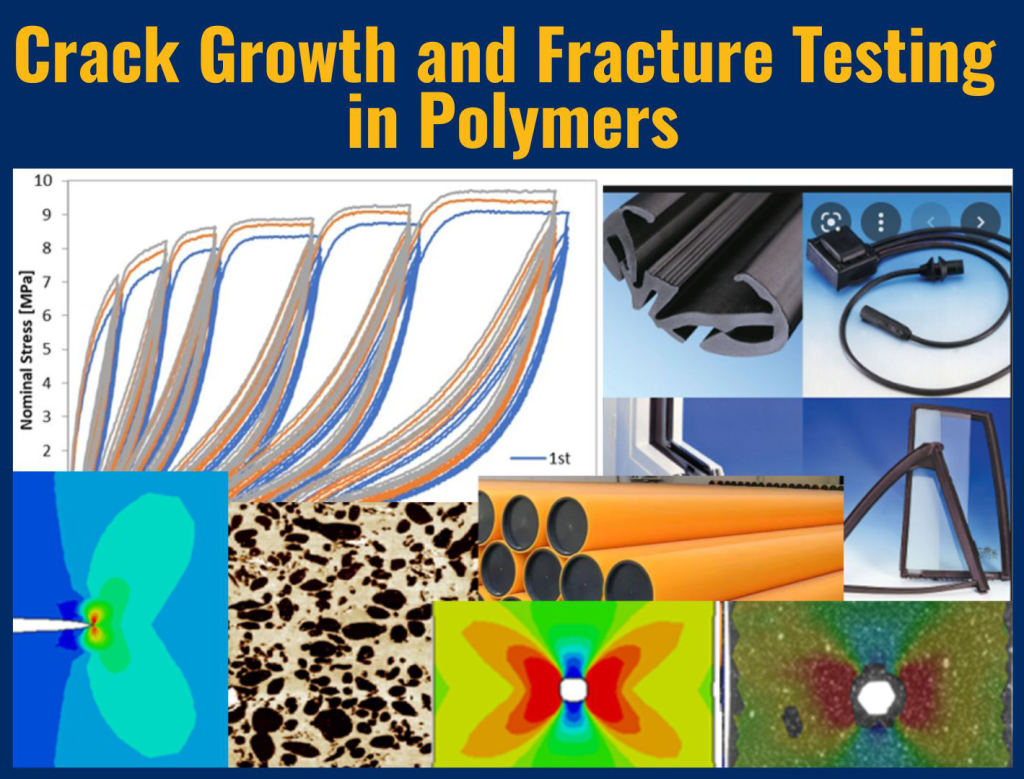
Crack Growth or Continuum Damage?

The topic of whether to use a crack growth method or a continuum damage method for product fatigue and durability assessment has long been debated. Oftentimes, experts will recommend using a continuum damage approach in the initial phase, when no noticeable cracks are present, and then transition to a crack growth analysis when damage has reached a certain level where cracks are likely to appear.  In other applications, most of the product’s life is consumed in the crack or crack growth initiation phase, so a continuum damage method is deemed most appropriate.  There are also cases where products are in service with known detectable cracks; in this case fracture mechanics and crack growth analysis is employed to predict how fast the crack will propagate and when it will reach a critical size.

The simplest continuum damage analysis uses Wöhler curves, or S-N diagrams and Palmgren-Miner’s rule.  The S-N diagrams are built by running fatigue tests on un-cracked dumbbell specimens at various stress amplitudes, S, and measuring the number of cycles to failure, Nf. Typical S-N diagrams are shown in Figure 1 [1].  The quantity Sf is the Endurance Limit (or Fatigue Limit), below which no failure is predicted to occur.


Figure 1. Typicaly S-N Diagrams [1]

A linear damage rule like the Palmgren-Miner rule states that the amount of damage due to a certain number of cycles, ni, at a certain stress amplitude, Si, is a simple linear ratio compared to the number of cycles to cause failure at that stress amplitude, or

(1)

The incremental amount of damage can then be summed over different blocks of cycles at different stress amplitudes to predict failure when

(2)

One of the limitations of this approach is that sequence effects, for example going from a high-to-low stress amplitude vs. going from a low-to-high stress amplitude is not accounted for. Stated another way, the rate of damage accumulation does not depend on the current state of damage. There also tends to be a large amount of scatter in the results.  In finite element implementations, the amount of damage is tracked towards failure, and damage can be included as a state variable in the constitutive law to allow the stiffness to evolve as a function of damage.

The Endurica methods of fatigue analysis combine fracture mechanics, crack growth, and continuum damage methods. In most materials, there are crack precursors on the micron, or sub-micron level that serve as crack growth initiators. Filled elastomers are known to have many discontinuities at the micron level due to, for example, voids filled with air, agglomeration of fillers or clumps of additives.  These are treated as an initial “pre-cursor” crack with the size c0 with typical values between 10 and 100 microns. Crack growth analysis is used to predict the number of cycles, or number of repeats of a block of cycles until the crack reaches a length indicative of the end of life of the product or component.

Rather than using stress as the driver for damage as in the SN diagram, a fracture parameter called Energy Release Rate, or Tearing Energy is used as the driver for crack growth rate.  An example plot is shown in Figure 2.

The analogy to the Endurance Limit in the S-N diagram is the Intrinsic Strength, T0, below which no crack growth is predicted.  The power-law portion of the plot with slope “F” can be expressed as

(3)


where rc is the crack growth rate when T = Tc, the Critical Tearing Energy.   In metals, this is termed a Paris Law, in elastomers, it is the Thomas Law [2].

The damage rate in this case is the crack growth rate, dc/dN. Also, the “damage” is tracked as the predicted length of a growing crack.  The summation of the damage over a given set of cycles can be written as


(4)


The Tearing Energy in a single edge cracked tension specimen is given by

 (5)


where W is the strain energy density far from the crack and k is a constant depending on strain level. In a general three-dimensional state of deformation, Endurica uses the Cracking Energy Density, Wc such that,

(6)

In each of these cases, the Tearing Energy, and thus the crack growth rate is predicted to depend on the crack length, c.

Combining equations 6 and 3, we see that the damage rate, dc/dN, in this analysis, will depend on the current state of damage, c, and thus be able to represent sequence effects as part of the analysis.

In the finite element implementation with the Endurica software, there is typically no explicit crack in the FEA model. Thus the calculation of damage in the form of a growing crack is like a continuum damage approach on the macro-scale.  A co-simulation workflow is also available where the stiffness of each element in the FEA model evolves with the calculation of crack length in each element.

The Endurica analysis methods can be viewed as a continuum damage method on the macro-scale, while using fracture mechanics and crack-growth analysis on the micro-scale.  The use of fracture mechanics provides many advantages including a well-developed and validated theory for elastomers, less scatter in fatigue experiments, nonlinear damage evolution and sequence effects, and the easy ability to include many other aspects such as temperature, aging, and strain crystallization.

References

[1]        Stephens, R. I., Fatemi, A., Stephens, R.R., and Fuchs, H.O., Metal Fatigue in Engineering, 2nd edition, John Wiley & Sons, 2001.

[2]        Thomas, A.G., “Rupture of Rubber  IV. Cut Growth in Natural Rubber Vulcanizates,” Journal of Polymer Science, Vol 31, pp 467-480, 1958.


twitterlinkedinmail

Proper tear testing of elastomers: Why you should tear up the Die C tear test

Endurica Fatigue Ninja tearing rubber

I spent an interesting and rewarding part of my career helping to lead an elastomer technical college in Yanbu, Saudi Arabia. One of the rubber technology words that was challenging for the Saudis to say in English was ‘tear’. They initially pronounced it like the heteronym related to crying. It might be a stretch to say that tears will come to your eyes if you don’t get tear testing of elastomers right, but proper measurement of critical tearing energy (tear strength) is essential for effective materials development for durability.

The fatigue threshold (intrinsic strength; T0) is the lower limit of the fatigue crack growth curve shown in the figure below, and we recently reviewed this material parameter including the various measurement options.1 The upper limit is the tear strength, TC. If loads in your elastomer component are near or above TC, then it is not a fatigue problem anymore but rather a critical tearing issue with imminent product failure. It is therefore important to accurately characterize this durability performance characteristic of your materials.

General fatigue crack growth behavior of elastomers

Endurica uses the planar tension (pure shear) geometry for measuring TC in our Fatigue Property Mapping testing services due to the simple relationship between the strain energy density (W) and the energy release rate (tearing energy, T).2,3 The TC is equal to the W at tearing multiplied by the initial specimen height, h. You can see this geometry below along with other tear testing specimens employed in the rubber industry and specified in the ASTM standard.4

Comparison of the different durability tests one can conduct: the differences between Crack Nucleation Test and Tear and Crack Growth Tests.

We sometimes get questions from folks with technical backgrounds in metals or plastics about whether rubber tear properties will be different when tested in distinct testing modes (mode I, mode II, etc.). It turns out that the extensibility of rubber causes the deformation to be predominately tension in the tearing region, irrespective of how the crack is opened, such that TC values are similar for rubber evaluated in different testing modes.2,3 Therefore, trouser tear testing is an alternative to the planar tension testing, as long as any stretching of the legs is accounted for in the data analysis.3,5 With no stretching of the legs, TC is simply given by 2F/t where F is the measured force to propagate the tear and t is the thickness of the specimen. The factor of 2 is surprisingly omitted in the ASTM standard4 even though it is mentioned in the appendix. The image below shows how to convert the ASTM trouser tear strength to TC.

Trouser tear strength testing

A proper tear test includes an initial macroscopic cut/crack in the specimen. This is not the case for Die C tear described in the tear testing standard.4 Die C is thus not a tear test at all but rather is a crack nucleation experiment akin to normal tensile testing of rubber. Because the strange Die C geometry forces failure in a small region in the center of the specimen, it is actually less useful than tensile strength testing of a dumbbell sample which probes the entire gauge region. The Die C test can also have substantial experimental variability related to the sharpness of the die used to punch out the samples. Unfortunately, the Die C “tear” test is the most popular method in the rubber industry to (incorrectly) assess the tear strength of elastomers, and this reality was a key motivator for writing this post. We look forward to seeing the rubber industry shift away from the Die C test, and we hope that the information provided here will help in that path to #GetDurabilityRight. Click here to learn how intrinsic strength and tear strength can be measured quickly and accurately (0:42 video).

References

  1. Robertson, C.G.; Stoček, R.; Mars, W.V. The Fatigue Threshold of Rubber and its Characterization Using the Cutting Method. Advances in Polymer Science, Springer, Berlin, Heidelberg, 2020, pp. 1-27.
  2. Lake, G.J. Fatigue and Fracture of Elastomers. Rubber Chem. Technol. 1995, 68, 435-460.
  3. Rivlin, R.S.; Thomas, A.G. Rupture of rubber. I. Characteristic energy for tearing. J. Polym. Sci. 1953, 10, 291–318.
  4. Standard Test Method for Tear Strength of Conventional Vulcanized Rubber and Thermoplastic Elastomers. Designation: ASTM D 624-00, ASTM International, West Conshohocken, PA, USA, 2020; pp. 1-9.
  5. Mars, W.V.; Fatemi, A. A literature survey on fatigue analysis approaches for rubber. Int. J. Fatigue 2002, 24, 949–961.
twitterlinkedinmail

Two Decades of Critical Plane Analysis

Critical Plane Analysis

It has been 20 years since Critical Plane Analysis for rubber was first conceived and validated.  There were early signs of its significance.  It won awards wherever I presented it. At the 1999 SAE Fatigue Design and Evaluation meeting, it won the Henry Fuchs award.  At the 2000 Tire Society meeting, it won the Superior Paper award. At the Fall 2000 ACS Rubber Division meeting, it won the Best Paper award.  Upon completing my 2001 doctoral thesis, we applied for and received a US patent (2003) on it.

The strongest early sign was that I soon found myself in company with others pursuing similar thinking.  The earliest was Dr. Nicolas Saintier.  As far as I know, neither of us was aware of the other’s work until 2006.  That was when he published an account similar enough to my own that when it came across my desk and I first started to read it, I felt certain he would cite my 2001 work as a source.  I have to admit to initially feeling let down when I reached the end of his paper and found no mention of my work.  I immediately looked for his other papers and found his 2001 doctoral thesis titled “Fatigue multiaxiale dans un élastomère de type NR chargé: mécanismes d’endommagement et critère local d’amorçage de fissure.” (Multiaxial fatigue life of a natural rubber: crack initiation mechanisms and local fatigue life criterion).  There it was – the same founding principle of Critical Plane Analysis that I had worked so hard to articulate and validate – the idea that cracks develop on a material plane, specifically the most critical material plane, and that their localized experience drives their evolution.  That we both articulated this beautifully simple and powerful principle in the same year with complete independence from each other, when no one else working on elastomers had yet spoken of this approach (there were precedents in the field of metal fatigue analysis), just shows that it was an idea whose time had come.

Although the foundational principle of Critical Plane Analysis was the same, there were also important differences between our accounts.  We differed on 1) how the critical plane is selected, 2) what criterion is used to quantify the severity of loading experience by the critical plane, 3) how damage on the critical plane evolves under solicitation.  The following table summarizes the key differences:


Table 1. Comparison of the Mars and Saintier Frameworks for Critical Plane Analysis.

Mars 2001 Saintier 2001
Critical Plane Selection Method Minimize the computed life after evaluation of damage on all planes Maximize the principal stress prior to evaluation of damage
Multiaxial Criterion Energy release rate estimated via cracking energy density on every plane Stress traction on the assumed critical plane
Damage Evolution Law Integration of crack growth rate law Power law Wohler curve
Strain Crystallization Law Treated as R ratio dependence of the crack growth rate law Treated as a modifier of the stress experienced on the critical plane

It may be said that Saintier’s approach followed more closely the precedents for Critical Plane Analysis in metal fatigue, particularly with respect to the method used to select the critical plane.  Selecting the plane is the first step in his method (identify the plane in order to compute the damage), but it is the last step in our method (compute the damage on each plane first and lastly pick the plane with the most damage).  Saintier’s approach also depends on a Wohler curve style characterization of fatigue behavior, where ours is defined via a crack growth rate law.  We have previously discussed the pros and cons of Wohler curves vs. fracture mechanics.  In our approach, we placed a high priority on taking advantage of the very large pre-existing body of knowledge on the fracture mechanical behavior of elastomers, and on the economic and operational advantages that crack growth experiments enjoy.

Since my and Saintier’s first steps, there have now been many others who have contributed in various forms to the overall method, its validation and/or its application.  It is safe to say that Critical Plane Analysis is here to stay, and set to continue expanding for many years (there are now several hundred research papers!).

For our part, Endurica is now in year 12 of delivering commercial grade fatigue analysis solutions built on this method.  Today, Critical Plane Analysis is a production analysis workflow used by many engineering organizations to solve critical durability issues.  It is the heart of the Endurica fatigue solver, and there are hundreds of trained users (look up the #fatigueninjas on twitter!).  It is unrivaled for its reliability, speed and accuracy in computing the impacts of multiaxial loading on durability.

What do the next 20 years hold?  We are going to see a transition in how fatigue analysis is used.  OEM organizations that manage durability and risk across rubber component supply chains will transition away from receiving fatigue simulation results on an optional basis towards requiring fatigue simulations by default on every part at the inception of new programs.  Expectations and achievement of cost-reduction, light weighting and sustainability initiatives will increase as product optimization begins to fully account for actual product use cases.  Critical Plane Analysis has already laid the foundation for these things to happen.  Older fatigue analysis methods that do not compete well against critical plane methods will become obsolete.  On the research side, there will be further development of material models for use in the critical plane framework.  Ageing, inelasticity, rate and anisotropy effects still need further development, for example.  In 20 years, durability will be just one more thing that engineers do well every day, whether or not they know that Critical Plane Analysis was how they did it.

Mars, W. V,  Multiaxial fatigue of rubber. Ph.D. Dissertation, University of Toledo, 2001.

Mars, W. V. “Multiaxial fatigue crack initiation in rubber.” Tire Science and Technology 29, no. 3: 171-185, 2001.

Mars, W. V. “Cracking energy density as a predictor of fatigue life under multiaxial conditions.” Rubber chemistry and technology 75, no. 1: 1-17, 2002.

Mars, W. V., “Method and article of manufacture for estimating material failure due to crack formation and growth.” U.S. Patent No. 6,634,236. 21 Oct. 2003.

Saintier, N, “Fatigue multiaxiale dans un élastomère de type NR chargé: mécanismes d’endommagement et critère local d’amorçage de fissure.” Ph. D Dissertation., Ecole des Mines de Paris, 2001.

Saintier, N, G. Cailletaud, R. Piques. “Crack initiation and propagation under multiaxial fatigue in a natural rubber.” International Journal of Fatigue 28, no. 1: 61-72, (2006).

twitterlinkedinmail

Conservatism and Tradition in Fatigue Analysis

Slide Rule

Because Endurica’s Critical Plane Analysis is a relatively new approach to fatigue analysis of elastomers (introduced in 2001), new users often ask whether its predictions are conservative: i.e., does its predictions reliably lean in favor of safety? And is it more or less conservative than the traditional approaches it supplants?

Fatigue analysis for elastomers follows two distinct traditions.  The earliest tradition traces to Sidney Cadwell’s work in 1940 which followed the even earlier ideas of metal fatigue pioneer August Wohler.  This tradition is based on matching up empirical crack nucleation curves to corresponding in-service operating conditions via convenient parameters such as stress or strain.  It is typically the first approach that engineers encounter in their undergraduate training, as it is often effective and relatively simple to apply.  A later tradition, Fracture Mechanics, traces to the post-WWII work of Ronald Rivlin and Alan Thomas in 1953 which extended Griffith’s seminal 1921 work on rupture to elastomers.  In this tradition, the energy requirements for growing a given crack provide the core organizing principle for analysis.  Combined with empirical crack growth rate curves, this approach can make high accuracy life predictions for a very broad range of application scenarios. This approach is typically first encountered in graduate-level engineering programs, and due to somewhat more complicated mathematics, usually requires specialized calculation software to apply it.

There are a few big holes in the Wohler curve approach.  For elastomers, perhaps the biggest limitation is that this approach assumes a priori that damage is associated with the maximum principal stress or strain.  This is sometimes true for simple cases, but not always: 1) strain crystallization is known to produce off-axis cracking not aligned with the principal stress, 2) compression is known to produce cracks on planes of maximum shearing, and 3) out-of-phase multiaxial loading cases do not even possess a unique, well-defined principal direction – the directions vary in time.  It is also well known that Wohler curves for rubber depend strongly on mode of deformation.  Fatigue experiments in simple tension, biaxial tension, simple shear, and simple compression do not simply resolve to a single universal curve, as the Wohler approach takes for granted.  To use this approach conservatively then requires that the most damaging mode of deformation – simple tension – be used as the baseline.

Perhaps the biggest limitation of the traditional Fracture Mechanics approach is that it typically focuses on only one crack at a time.  In fatigue, structures begin with many microscopic cracks distributed randomly throughout.  Most of the fatigue life of the structure is spent growing many small cracks.  Only towards the very end of life do one or a few large cracks finally emerge as worst cases.  True conservatism would mean tracking the growth of all of possible large cracks, and finding out which one(s) grow the fastest.  But traditional fracture mechanics tools are not well adapted for this task.  They require up front assumptions about the location and shape of the worst case crack.  How can you find a worst case without considering many alternatives?

Critical Plane Analysis is simply the idea that a crack could occur anywhere in a structure, and it could occur in any orientation.  It checks all of the possibilities, and it finds the worst ones.  It looks at the specific loading experiences of each individual crack plane that might occur.  It takes account of material behavior like strain crystallization.  It takes account of crack closure conditions.  It takes account of the fracture mechanical behavior of small cracks.  It does not make unwarranted assumptions about the orientation of cracks.  It correctly predicts the orientation of cracks for all modes of deformation.  It is the most exhaustive and conservative fatigue analysis that you can do.

Don’t mistake traditional approaches with the conservative approach.  Critical Plane Analysis is, by definition, the most conservative approach because it doesn’t make any assumptions about crack location or orientation, and because it checks all of the possible ways a crack might occur.

twitterlinkedinmail

Wohler Curves or Fracture Mechanics?

Endurica uses a fracture mechanics based description of rubber’s fatigue behavior, rather than the classical Wohler curve (ie S-N curve) approach.  This is why:

1) Wohler curves in rubber show the combined effects of several nonlinear processes, but they do not easily deconvolve into useful information about the individual processes.  This means that Wohler curve users struggle to trace the causes of fatigue failures any deeper than the single monolithic empirical SN curve.  When the customer or the boss asks why the part is failing, Wohler curve users end up falling back on the old “rubber is mysterious” defense.  Meanwhile, users of critical plane analysis + fracture mechanics are hypothesis testing. They can check what events and what loading directions are most damaging, and what material parameters (crack precursor size, strain crystallization, threshold, crack growth rate law, thermal effects, etc.) can be exploited to gain leverage and solve the issue.

2) Fatigue failure in rubber is often dominated by “special effects”: dependence on strain level, dependence on R ratio, dependence on temperature, dependence on rate, dependence on ageing, etc. The Wohler curve crowd must choose between ignoring/oversimplifying these special effects, or running an experimental matrix that rapidly scales to an infeasibly huge size as more variables are added.  While fracture mechanics users obtain a wealth of information from a single test specimen (one test can probe many different strain levels, temperatures, rates, etc), Wohler curve users obtain 1 data point per tested specimen.  Look in the rubber technical literature and count the number of S-N-curves that are given, relative to the number of fatigue crack growth rate curves.  Google/scholar returns less than 2000 results for “rubber Wohler curve”, and 78700 results for “rubber crack growth curve”.  There is a reason that crack growth rate curves outnumber Wohler curves.

3) SN based methods are not conservative. Wohler curve users end up assuming that a crack will show up perpendicular to a max principal stress or strain direction.  This assumption only works when you have the very simplest loading cases, no compression, and no strain crystallization.  Users of fracture mechanics + critical plane analysis don’t worry about whether they have simple loading, finite straining,  out-of-phase loading, compressive loading, changing principal directions, and/or strain crystallization.  Critical plane analysis checks every possible way a crack might develop and is therefore assured to always find the worst case regardless of detailed mechanisms.

4) Wohler curves are messy. They depend strongly on crack precursor size, which naturally varies specimen-to-specimen, batch-to-batch, and between lab mix and factory processes.  During SN curve testing, the size of the crack is neither measured nor controlled.  This accounts for the extra scatter that is typical in these tests.  In fracture mechanics testing, on the other hand, the crack is measured and controlled, leading to more repeatable and reliable results.  Noisy data means that the Wohler curve crowd has trouble differentiating between material or design options.  Users of fracture mechanics benefit from cleaner results that allow more accurate discrimination with less replication.

A Wohler curve does have one valuable use.  The Wohler curve can be used to calibrate the crack precursor size for a fracture mechanics analysis. It only takes a few data points – not the entire curve, since the crack precursor size does not depend on strain level, or other “special effects” variables.  Our recommended practice is to run a small number of nucleation style tests for this purpose only, then leverage fracture mechanics to characterize the special effects.

The bottom line is that, for purposes of general fatigue life prediction in rubber, the Wohler curve method loses technically and economically to the fracture mechanics + critical plane analysis based method that is used in modern fatigue solvers.

twitterlinkedinmail
close
Trial License RequestTrial License RequestTrial License RequestTrial License RequestTrial License Request

Our website uses cookies. By agreeing, you accept the use of cookies in accordance with our cookie policy.  Continued use of our website automatically accepts our terms. Privacy Center