Crack Growth or Continuum Damage?
The topic of whether to use a crack growth method or a continuum damage method for product fatigue and durability assessment has long been debated. Oftentimes, experts will recommend using a continuum damage approach in the initial phase, when no noticeable cracks are present, and then transition to a crack growth analysis when damage has reached a certain level where cracks are likely to appear. In other applications, most of the product’s life is consumed in the crack or crack growth initiation phase, so a continuum damage method is deemed most appropriate. There are also cases where products are in service with known detectable cracks; in this case fracture mechanics and crack growth analysis is employed to predict how fast the crack will propagate and when it will reach a critical size.
The simplest continuum damage analysis uses Wöhler curves, or S-N diagrams and Palmgren-Miner’s rule. The S-N diagrams are built by running fatigue tests on un-cracked dumbbell specimens at various stress amplitudes, S, and measuring the number of cycles to failure, Nf. Typical S-N diagrams are shown in Figure 1 [1]. The quantity Sf is the Endurance Limit (or Fatigue Limit), below which no failure is predicted to occur.
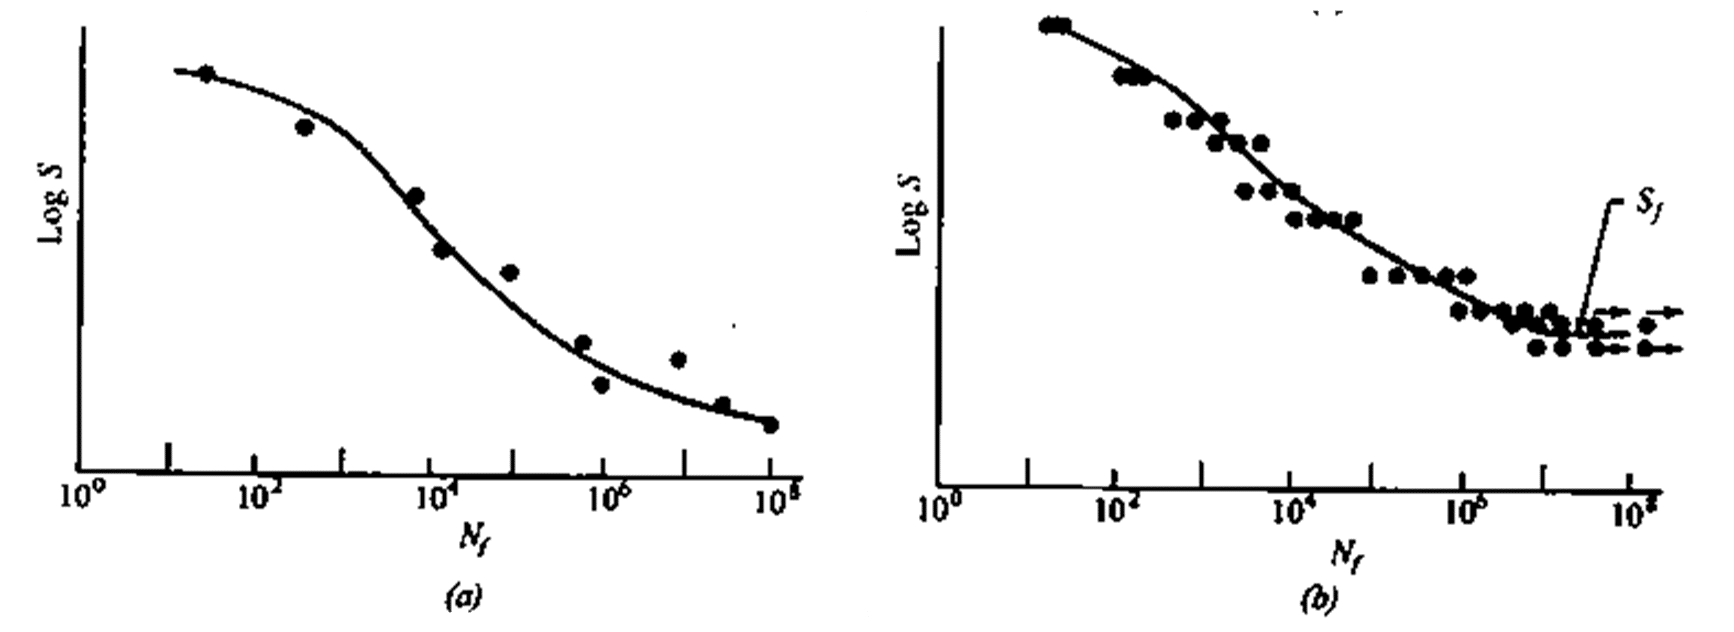
Figure 1. Typicaly S-N Diagrams [1]
A linear damage rule like the Palmgren-Miner rule states that the amount of damage due to a certain number of cycles, ni, at a certain stress amplitude, Si, is a simple linear ratio compared to the number of cycles to cause failure at that stress amplitude, or
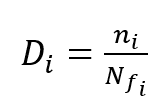 (1)
(1)
The incremental amount of damage can then be summed over different blocks of cycles at different stress amplitudes to predict failure when
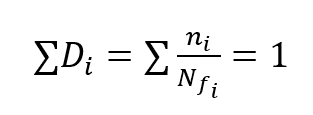 (2)
(2)
One of the limitations of this approach is that sequence effects, for example going from a high-to-low stress amplitude vs. going from a low-to-high stress amplitude is not accounted for. Stated another way, the rate of damage accumulation does not depend on the current state of damage. There also tends to be a large amount of scatter in the results. In finite element implementations, the amount of damage is tracked towards failure, and damage can be included as a state variable in the constitutive law to allow the stiffness to evolve as a function of damage.
The Endurica methods of fatigue analysis combine fracture mechanics, crack growth, and continuum damage methods. In most materials, there are crack precursors on the micron, or sub-micron level that serve as crack growth initiators. Filled elastomers are known to have many discontinuities at the micron level due to, for example, voids filled with air, agglomeration of fillers or clumps of additives. These are treated as an initial “pre-cursor” crack with the size c0 with typical values between 10 and 100 microns. Crack growth analysis is used to predict the number of cycles, or number of repeats of a block of cycles until the crack reaches a length indicative of the end of life of the product or component.
Rather than using stress as the driver for damage as in the S–N diagram, a fracture parameter called Energy Release Rate, or Tearing Energy is used as the driver for crack growth rate. An example plot is shown in Figure 2.
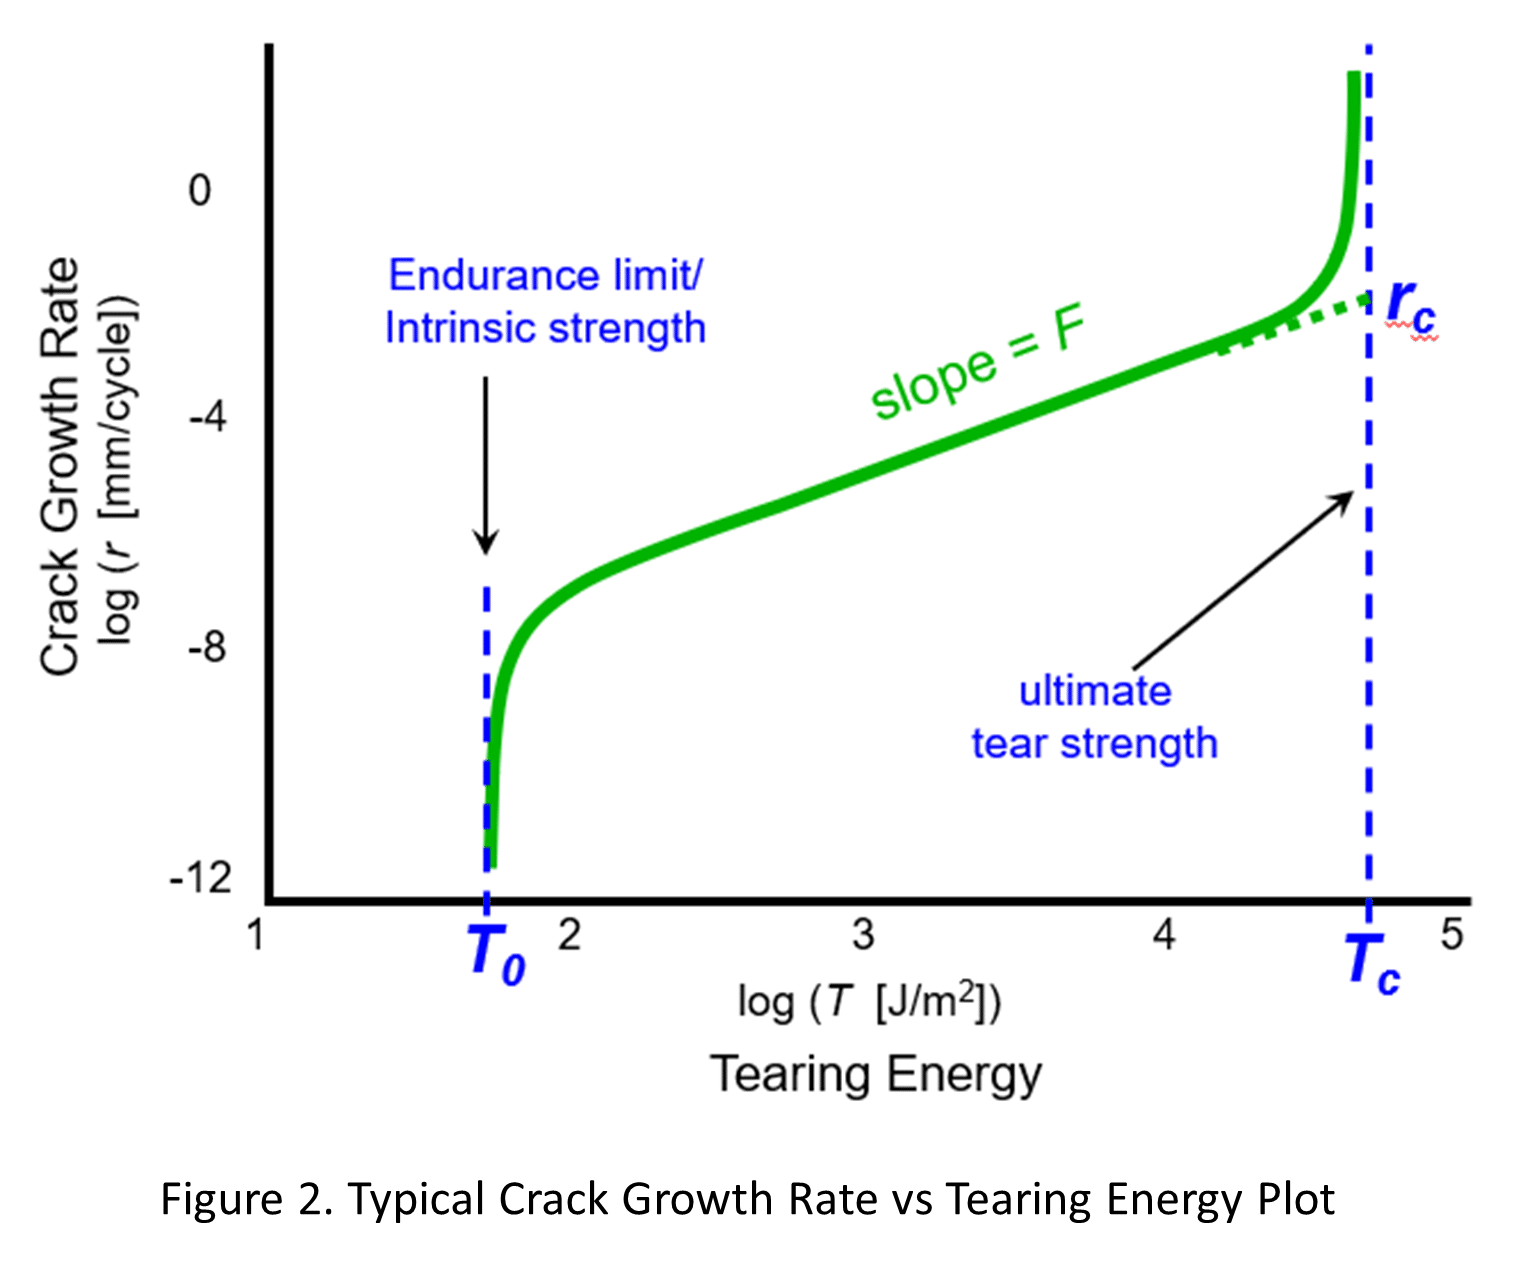
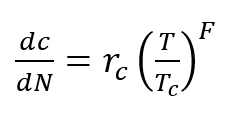
The analogy to the Endurance Limit in the S-N diagram is the Intrinsic Strength, T0, below which no crack growth is predicted. The power-law portion of the plot with slope “F” can be expressed as
 (3)
(3)
where rc is the crack growth rate when T = Tc, the Critical Tearing Energy. In metals, this is termed a Paris Law, in elastomers, it is the Thomas Law [2].
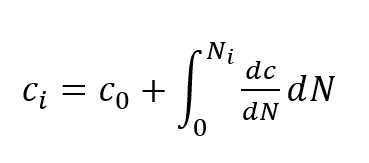
The damage rate in this case is the crack growth rate, dc/dN. Also, the “damage” is tracked as the predicted length of a growing crack. The summation of the damage over a given set of cycles can be written as
 (4)
(4)
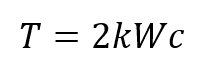
The Tearing Energy in a single edge cracked tension specimen is given by
 (5)
(5)
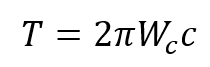
where W is the strain energy density far from the crack and k is a constant depending on strain level. In a general three-dimensional state of deformation, Endurica uses the Cracking Energy Density, Wc such that,
 (6)
(6)
In each of these cases, the Tearing Energy, and thus the crack growth rate is predicted to depend on the crack length, c.
Combining equations 6 and 3, we see that the damage rate, dc/dN, in this analysis, will depend on the current state of damage, c, and thus be able to represent sequence effects as part of the analysis.
In the finite element implementation with the Endurica software, there is typically no explicit crack in the FEA model. Thus the calculation of damage in the form of a growing crack is like a continuum damage approach on the macro-scale. A co-simulation workflow is also available where the stiffness of each element in the FEA model evolves with the calculation of crack length in each element.
The Endurica analysis methods can be viewed as a continuum damage method on the macro-scale, while using fracture mechanics and crack-growth analysis on the micro-scale. The use of fracture mechanics provides many advantages including a well-developed and validated theory for elastomers, less scatter in fatigue experiments, nonlinear damage evolution and sequence effects, and the easy ability to include many other aspects such as temperature, aging, and strain crystallization.
References
[1] Stephens, R. I., Fatemi, A., Stephens, R.R., and Fuchs, H.O., Metal Fatigue in Engineering, 2nd edition, John Wiley & Sons, 2001.
[2] Thomas, A.G., “Rupture of Rubber IV. Cut Growth in Natural Rubber Vulcanizates,” Journal of Polymer Science, Vol 31, pp 467-480, 1958.