
“I’m pleased to share that my latest article has been accepted for publication” is among the best email subject lines someone in a technical company... Continue reading
Return to previous page
Tag: engineering

The load cases to be considered in fatigue analysis can be very lengthy and can involve multiple load axes. Often, load cases are much longer... Continue reading
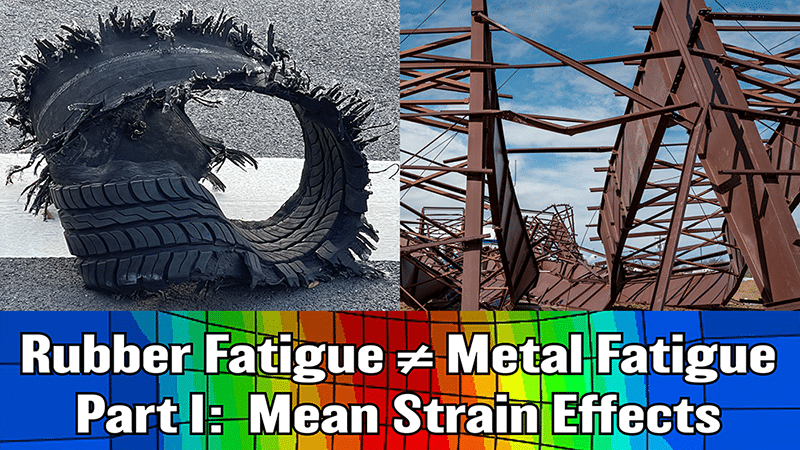
Rubber and metal are very different materials that exhibit very different behaviors. Consider the effect of mean strain or stress on the fatigue performance of... Continue reading
Ever wonder what it takes to consistently deliver quality and reliability in our software releases? Here’s a brief overview of the systems and disciplines we... Continue reading

What value does your company gain by deploying product development resources one way vs. another when it comes to durability? R&D organizations are built around... Continue reading
Every year, the top minds from academia, government and industry gather in Akron to share their work at the Tire Society annual meeting, and to... Continue reading