Getting a Quick Read on Durability with the Intrinsic Strength Analyser

There is now a one-hour test on a benchtop instrument for the rubber lab to screen materials for long-term fatigue performance. Please continue reading to learn more about this commercialization of a classical elastomer characterization methodology.

Rubber products manufacturers and raw materials suppliers seeking improved materials for next-generation applications depend on lab tests to predict end-use performance. These predictive tests should balance accuracy, relevance, and testing time. The testing time component is particularly challenging when the performance characteristic of interest is fatigue lifetime. The image of traditional fatigue testers chattering along for days or weeks comes to mind for those of us with experience in industrial rubber labs. The time consideration is the reason why tensile stress-strain testing (stretching a material to high strains until failure) is the most common physical test for the fracture behavior of rubber, in clear contrast to the most prevalent application condition for rubber products which is cyclic loading (fatigue) at much lower strains.

Fatigue crack growth is a key element of elastomer behavior that must be determined in order to predict durability, as illustrated below. For example, fatigue crack growth (FCG) testing provides the FCG rate law that is essential for predicting when and where cracks will show up in rubber products using Endurica’s elastomer fatigue software for finite element analysis [https://endurica.com/integrated-durability-solutions-for-elastomers/]. Endurica has developed a finitely scoped, reduced variability measurement approach1 which is used in our Fatigue Property Mapping testing services and is available on the Coesfeld Tear and Fatigue Analyser (TFA). Our standard FCG measurement protocol takes 20 hours of continuous testing. This testing time is very efficient for characterizing best candidate materials in the development process, but a faster test is needed for narrowing down, for example, 20 initial materials to 5 best candidates or for use in a plant lab to monitor quality of rubber compounding processes.

Key Components of Elastomer Fatigue and Failure

The Intrinsic Strength Analyser (ISA) is a recent addition to the durability testing solutions for elastomers. The ISA was developed through a partnership between Coesfeld GmbH & Co. (Dortmund, Germany) and Endurica LLC (Findlay, OH, USA), and this benchtop instrument employs a testing protocol based on the long-established cutting method of Lake and Yeoh.3,4 Endurica’s president, Dr. Will Mars, discusses the importance of measuring intrinsic strength (fatigue threshold) in this video on our YouTube channel which also shows some footage of the ISA in operation:

https://www.youtube.com/watch?v=BL92ppsJZfE

The fatigue crack growth curve of rubbery materials is bounded by the fatigue threshold, T0, on the low tearing energy (T) side and by the critical tearing energy (tear strength), Tc, at the high-T end. This is depicted in the generalized figure below. A streamlined one-hour procedure on the ISA can measure both T0 and Tc which can then be used to estimate the slope (F) of the intermediate FCG power law response that correlates well with the actual F from rigorous FCG testing using the TFA (see figure). More information about this quick ISA approach to characterizing rubber crack growth behavior for materials development and quality control can be found in the Annual Review 2019 issue of Tire Technology International (open access).2

ISA graph showing Crack Growth Rate compared to tearing energy

The fatigue crack growth slope

The fatigue crack growth slope, F, from the ISA should be considered an approximate value that is useful for comparing the relative FCG behavior of materials. However, the determination of T0 on the ISA is highly quantitative and the only realistic option for assessing this parameter, since the near-threshold crack growth testing on the TFA needed to define T0 would take about a month. The implementation areas for the ISA and TFA are compared in the following table. A very conservative approach to product development for elastomer durability is to create a combination of material behavior and component design that places the final operation of the rubber product below the fatigue threshold. If this is your company’s approach to engineering for durability, then the ISA is the testing instrument you need.

Durability Testing Solutions for the Rubber Lab

Crack precursor size is another key characteristic of elastomers that needs to be quantified in order to predict durability. In combination with a standard tensile stress-strain test, the critical tearing energy (Tc) from the ISA can also be used to assess crack precursor size, as we showed recently in an open access publication.5

Endurica is the exclusive Americas distributor of the Coesfeld ISA and TFA instruments. Endurica’s efficient and effective testing protocols are provided on these high-quality instruments for the rubber laboratory. To learn more about how to add these testing capabilities to your lab, please contact us at info@endurica.com.

References

  1. J. R. Goossens and W. V. Mars, “Finitely Scoped, High Reliability Fatigue Crack Growth Measurements”, Rubber Chem. Technol. 91, 644 (2018).
  2. C. G. Robertson, R. Stoček, R. Kipscholl, and W. V. Mars, “Characterizing Durability of Rubber for Tires”, Tire Technology International, Annual Review 2019, pp. 78-82.
  3. G. J. Lake and O. H. Yeoh, “Measurement of Rubber Cutting Resistance in the Absence of Friction”, International Journal of Fracture 14, 509 (1978).
  4. C. G. Robertson, R. Stoček, C. Kipscholl, and W. V. Mars, “Characterizing the Intrinsic Strength (Fatigue Threshold) of Natural Rubber/Butadiene Rubber Blends”, Tire Sci. Technol. 47, 292 (2019).
  5. C. G. Robertson, L. B. Tunnicliffe, L. Maciag, M. A. Bauman, K. Miller, C. R. Herd, and W. V. Mars, “Characterizing Distributions of Tensile Strength and Crack Precursor Size to Evaluate Filler Dispersion Effects and Reliability of Rubber”, Polymers 12, 203 (2020).
twitterlinkedinmail

Calibrating Crack Precursor Size in Endurica CL

Crack precursors exist in all elastomers owing to the heterogeneous microstructure, even before any loads are applied. The size of the typical precursor must be specified as part of the Endurica fatigue analysis workflow.  The best practice for finding the precursor size is to leverage both crack growth and crack nucleation experiments to enforce agreement between the nucleation test results and the corresponding simulation-predicted life results.  This procedure guarantees that both the crack growth and the crack nucleation experiments add up to an overall consistent story. 

Prior to performing the calibration, you will need to have already defined the hyperelastic law, and the fatigue crack growth rate law. Fatigue models used for rubber have the following parameters:

  • Relationship between tearing energy and crack growth rate
    • The parameters needed to define this relationship are obtained through fatigue crack growth experiments. The crack is loaded under a range of tearing energies while tracking growth of the crack. These tests obtain the critical tearing energy, Tc, which is the tearing energy at which the crack reaches end of life failure in one loading. The crack growth rate at critical tearing energy, rc, and the slope of the curve, F, are determined by fitting a power law to the experimental crack growth and tearing energy.
  • Threshold
    • This is the tearing energy limit T0 below which cracks do not grow. If you do not specify this parameter, then you will use the Thomas law. If you do specify this parameter, you will use the Lake-Lindley law.  The threshold can be measured using an Intrinsic Strength experiment.
  • Strain Crystallization
    • Some rubbers exhibit a strain crystallization behavior that causes an increase of durability under non-relaxing loads. If the duty cycle of your calibration experiment is nonrelaxing, and if you have a strain crystallizing material, then this characterization should be completed before calibrating the precursor size.  The strain crystallization effect is measured in the non-relaxing module.
  • End of life crack size
    • This parameter should be set in the material definition prior to calibrating the precursor size. A default value of 1mm is generally adequate, particularly when it turns out that the precursor size is at least 5x smaller than this value.  The part is considered to have failed when a crack reaches this size. 

The crack nucleation experiment used for the calibration procedure may be made on a material test coupon, or on an actual component.  Test coupons are convenient in early development stages as they do not require having a part to test.  So long as crack precursor size is controlled by intrinsic features of the compound recipe (and not by the extrinsic features of post-mixing processes), a test coupon is likely to give useful results.  There is a risk when using a test coupon: the risk that the precursor size in a manufactured part is actually controlled by some feature of post-mixing process such as factory contamination, part molding, abrasion, etc.  This risk can be mitigated by calibrating precursor size on the basis of crack nucleation experiments on the finished part.  In the following example, we show the process for calibration based on a finished part.  The process for a test coupon is the same, but the model of the part is replaced by a model of the specimen. 

To illustrate, take the case of a rubber bumper spring. Its duty cycle consists of compressing the 150 mm long rubber spring by 80 mm. Experiments show a fatigue life of 282,534 cycles for this duty cycle. A finite element analysis of the rubber spring is made to obtain strain history. The rubber spring is shown in the image below at the initial condition, at 50% of the displacement, and at 100% of the displacement during the fatigue duty cycle.

The rubber spring at the initial condition, at 50% of the displacement, and at 100% of the displacement during the fatigue duty cycle


We are now ready to calibrate the as yet unknown precursor size to the known experimental fatigue test result of the spring. The precursor size can be calibrated by calculating the fatigue life for a series of precursor sizes and then interpolating to find the one precursor size that results in the best agreement between fatigue life calculations and the experimental fatigue life. Use the PRECURSORSIZE_CALIBRATION output request in Endurica CL to produce a table of fatigue life vs. crack precursor size. Your output request syntax will look something like this:

**OUTPUT

PRECURSORSIZE_CALIBRATION, NFS=25, FSMIN=1e-2
LIFE

NFS is the number of precursor sizes to evaluate, in this case 25.  FSMIN is the smallest precursor size to evaluate, in this case 0.01 mm. 

Once you’ve executed the calibration, use the new Endurica Viewer to complete the calibration workflow. It can plot a wide range of Endurica analysis outputs including precursor size calibration. Just open the Endurica output file containing the calibration results and expand the output file contents tree to find the Precursor Size Calibration results.  The viewer then plots the computed table of precursor size vs fatigue life.

The viewer plots the computed table of precursor size vs fatigue life


If you click on the plot options in the upper left corner, you can input the target life and the viewer will interpolate the precursor size. In this case, for a life of 282,534 cycles, the corresponding precursor size is 39 microns. Now that the precursor size is calibrated, the spring geometry can be optimized, different loadings analyzed, or entirely different parts can be analyzed using the material model to get fatigue life results that accurately reflect the precursor size that is most representative of the final material in the part. Again, if a part is not available, precursor size can also be calibrated to fatigue results from standard simple tension test specimen.

The calibrated rubber spring FE model with the life result of 282,534 cycles is shown below.

The calibrated rubber spring FE model with the life result of 282,534 cycles is shown below.

twitterlinkedinmail

Integrated Durability Solutions for Elastomers

Will the durability of your new rubber product meet the expectations of your customers? 

Do you have a comprehensive capability that fully integrates all of the disciplines required to efficiently achieve a targeted durability spec?

Your engineers use finite element analysis (FEA) to model the elastomer component in the complex geometry and loading cycle for the desired product application.  One traditional approach to predicting durability is to develop a rough estimate of lifetime by looking at maximum principal strain or stress in relation to strain-life or stress-life fatigue curves obtained for the material using lab specimens in simple tension.  The difficulties and uncertainties with this method were discussed in a recent blog post.

a rough estimate of lifetime by looking at maximum principal strain or stress in relation to strain-life or stress-life fatigue curves obtained for the material using lab specimens in simple tension


A modern approach to elastomer durability is to use the Endurica CL™ durability solver for FEA.  This software uses rubber fracture mechanics principles and critical plane analysis to calculate the fatigue lifetime – which is the number of times the complex deformation cycle can be repeated before failure – for every element of the model.  This provides engineers with the ability to view lifetime throughout the FEA mesh, allowing them to modify design features or make material changes as needed to resolve short-lifetime areas.

view lifetime throughout the FEA mesh, allowing them to modify design features or make material changes as needed to resolve short-lifetime areas.

A sound finite element model of the elastomer product in the specified loading situation and fundamental fatigue material parameters from our Fatigue Property Mapping™ testing methods are the two essential inputs to the Endurica CL software.  This is illustrated in the figure below.

A sound finite element model of the elastomer product in the specified loading situation and fundamental fatigue material parameters from our Fatigue Property Mapping™ testing methods are the two essential inputs to the Endurica CL software.

The requisite elastomer characterization methods can be conducted by us through our testing services or by you in your laboratory with our testing instruments.  For some companies, consulting projects are a route to taking advantage of the software before deciding to license the unique predictive capabilities.  The following diagram shows how our products and services are integrated.

Durability Solutions for Elastomers

For companies that are just getting started with implementing our durability solutions, the following is a typical testing services and consulting project:

  1. We use our Fatigue Property Mapping™ testing methods, through our collaboration with Axel Products Physical Testing Services, to characterize the properties of cured sheets of rubber compounds sent to us by the client. The minimum requirements for fatigue modeling are crack precursor size and crack growth rate law, and these are quantified within our Core Fatigue Module.  Special effects like strain-induced crystallization and aging/degradation are accounted for using other testing modules when applicable.
  2. The client sends us the output files from their finite element analysis (FEA) of their elastomer part design for the deformation of their complex loading cycle. It is common for the goal to be a comparison of either two designs, two distinct loading profiles, two different rubber compounds, or combinations of these variations.  Our software is fully compatible with Abaqus™, ANSYS™, and MSC Marc™, so the simulations can be conducted on any of these FEA platforms.  In some situations where a client does not have their own FEA capabilities, one of Endurica’s engineers will set up the models and perform the analyses instead.
  3. The fatigue parameters and FEA model are inputted to Endurica CL fatigue solver to calculate values of the fatigue lifetime for every element of the model. The lifetime results are then mapped back onto the finite element mesh in Abaqus, ANSYS, or MSC Marc so that the problem areas (short lifetime regions) within the geometry can be highlighted.
  4. We review the results with the client and discuss any opportunities for improving the fatigue performance through design and material changes.

Advanced implementors of our durability solutions have licensed the Endurica CL software and are using our rubber characterization methods in their laboratories on a routine basis, with instruments provided through our partnership with Coesfeld GmbH & Co. (Germany).  One recently publicized example of a company using the Endurica approach to a very high degree is Tenneco Inc., which you can read about here.

We want to help you #GetDurabilityRight, so please contact us at info@endurica.com if you would like to know more about how Endurica’s modern integrated durability solutions for elastomers can help enable a product development path that is faster, less expensive, and more confident.twitterlinkedinmail

Strain-Induced Crystallization in High Cis Butadiene Rubber: Fact or Fiction?

There is an ongoing drive to create synthetic rubber that can give mechanical performance matching the properties of natural rubber (NR) – excellent strength, tear resistance, and fatigue crack growth resistance – which are attributed to the ability of NR to strain crystallize.  I have attended several technical conferences in the tire and rubber field where I have witnessed presentations about new grades of polybutadiene (butadiene rubber (BR)) with high cis-1,4 structure, wherein a claim is made about the improved ability of the BR to undergo strain-induced crystallization (SIC) for better mechanical properties in tires and other rubber applications.  Similar statements can be found in technical marketing materials and in patents.1,2  To what extent is this true?  This post takes a closer look at this topic.

It is first useful to show why strain-induced crystallization is key to the unique mechanical properties of natural rubber.  One of the most conclusive studies on the function of strain-induced crystals to slow the growth of cracks in cyclic fatigue is the work by Brüning et al.3  The movie below from this research shows an edge crack region in NR reinforced with 40 phr of N234 carbon black that is experiencing cyclic deformation from 0% to 70% planar tension at a frequency of 1 Hz.  Each pixel at each time in the video represents a wide-angle X-ray diffraction pattern collected in real time while stretching in a synchrotron X-ray beam, with red color used to indicate crystallinity and black for purely amorphous regions.  You can see the crystals form during stretching which self-reinforces the rubber at the crack tip region to resist further growth of the crack.  These experiments are very revealing, but they are extremely difficult and expensive to perform, as they require scattering analysis expertise, specially designed stretching devices with precise spatial control, and access to one of the few national laboratory sites where synchrotron X-ray studies can be performed.

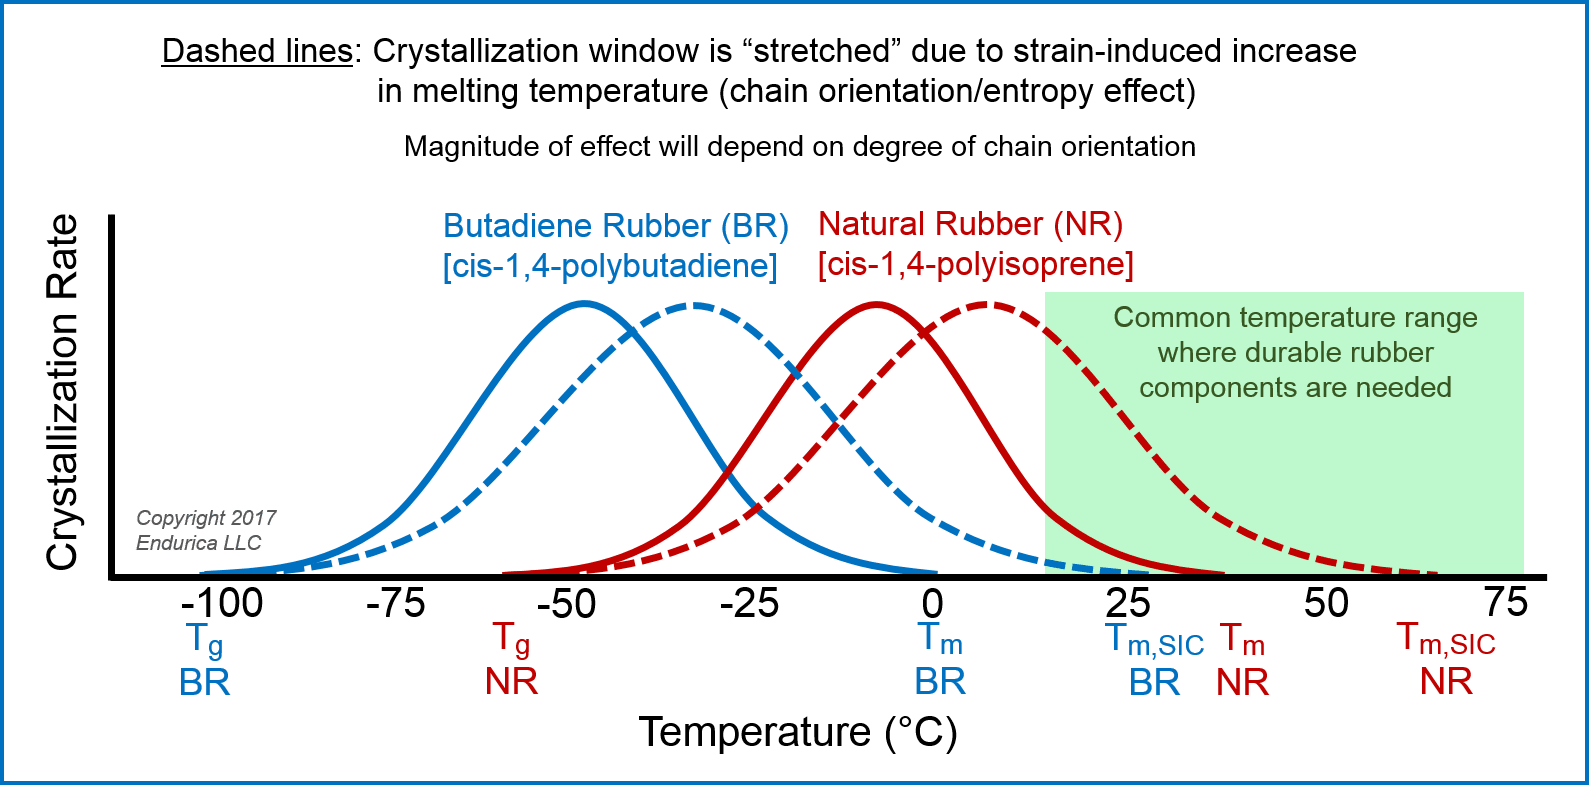
Stereoregular polymers can crystallize in a window bounded by the glass transition temperature (Tg) and the melting temperature (Tm). When stretched, a polymer can crystallize at temperatures above its normal melting temperature due to melting temperature elevation caused by the well-known chain orientation/entropy effect.4  Chain orientation results in an increase in melting temperature from Tm to Tm,SIC.  This is shown schematically in the figure below for NR and BR.  The Tg and Tm for BR are significantly lower than the values for NR.  Therefore, even after perfecting the structure of polybutadiene to achieve >98% cis-1,4 structure though catalyst and process innovations, BR still has an intrinsic disadvantage compared to NR when it comes to SIC in the common temperature range where durable rubber components are employed.


Gent and Zhang5 recognized the lower Tm,SIC for BR compared to NR for samples crystallized in uniaxially strained conditions.  Ultra high cis BR with 98% cis content did not show any evidence of strain-induced crystallization at 23 °C whereas NR clearly exhibited SIC in a study by Kang and coworkers.6  In an investigation by Toki et al.,7 it was necessary to reduce the temperature to 0°C before high cis BR showed a crystalline X-ray scattering pattern at a strain of 5 (500% elongation).

As an aside, I will caution the use of the entropy-driven melting temperature increase as the only explanation for strain-induced crystallization above the normal Tm.  Natural rubber is quite a slow crystallizing polymer in the unstretched state, even when annealed in the prime crystallization regime midway between Tg and Tm.  In stark contrast, strain-induced crystallization occurs very fast in NR which highlights the complexity of behavior beyond the over-simplification given in the figure above.

So, why is there not more focus on synthetic high cis-1,4-polyisoprene which has the same polymer microstructure and strain crystallization window as NR?  The short answer is that the butadiene monomer is much more commercially available than isoprene at many synthetic rubber plants around the world.  I remember the early years in my industrial R&D career when I was working with some very talented polymer chemists at Bridgestone / Firestone.   I was developing new molecular architectures for improved synthetic rubber to use in various tire compounds.  The chemists told me that they could make almost any polymer design I wanted, as long as it could be made from styrene and/or butadiene.  This restriction reflected the fact that these two monomers were the commonly available feedstocks at the commercial plants where the polymers would eventually be produced.

In closing, it is a fact that high cis polybutadiene can strain crystallize at sub-ambient temperatures, but it is fiction that it will strain crystallize in the same manner as natural rubber at room temperature and above.

Do you want to see if your rubber will really exhibit strain-induced crystallization in a practical way that is relevant to end-use applications?  Contact me (via email: cgrobertson@endurica.com) to learn more about the Non-Relaxing Module in Endurica’s portfolio of testing services that was specifically developed to efficiently highlight SIC effects.8-10

References

1 http://arlanxeo.de/uploads/tx_lxsmatrix/sustainable_mobility_01.pdf

2  S. Luo, K. McKauley, and J. T. Poulton, “Bulk polymerization process for producing polydienes”, U.S. Patent 8,188,201, granted May 29, 2012 to Bridgestone Corporation.

3 K. Brüning, K. Schneider, S. V. Roth, and G. Heinrich, “Strain-induced crystallization around a crack tip in natural rubber under dynamic load”, Polymer 54, 6200 (2013).; movie provided to Endurica LLC by the authors (movie to be used only with permission from Karsten Brüning).

4 P. J. Flory, “Thermodynamics of crystallization in high polymers. I. Crystallization induced by stretching”, Journal of Chemical Physics 15, 397 (1947).

5 A. N. Gent and L.-Q. Zhang, “Strain-induced crystallization and strength of elastomers. I. cis-1,4-polybutadiene”, Journal of Polymer Science Part B: Polymer Physics 39, 811 (2001)

6 M. K. Kang, H.-J. Jeon, H. H. Song, and G. Kwag, Strain-induced crystallization of blends of natural rubber and ultra high cis polybutadiene as studied by synchrotron X-ray diffraction”, Macromolecular Research 24, 31 (2016).

7 S. Toki, I. Sics, B. S. Hsiao, S. Murakami, M. Tosaka, S. Poompradub, S. Kohjiya, and Y. Ikeda, “Structural developments in synthetic rubbers during uniaxial deformation by in situ synchrotron X-ray diffraction”, Journal of Polymer Science Part B: Polymer Physics 42, 956 (2004).

8 K. Barbash and W. V. Mars, “Critical Plane Analysis of Rubber Bushing Durability under Road Loads”, SAE Technical Paper 2016-01-0393, 2016, https://doi.org/10.4271/2016-01-0393.

9 W. V. Mars and A. Fatemi. “A phenomenological model for the effect of R ratio on fatigue of strain crystallizing rubbers”, Rubber Chemistry and Technology 76, 1241 (2003).

10 https://endurica.com/specifying-strain-crystallization-effects-for-fatigue-analysis/


 twitterlinkedinmail

Our website uses cookies. By agreeing, you accept the use of cookies in accordance with our cookie policy.  Continued use of our website automatically accepts our terms. Privacy Center