Rubber Fatigue ≠ Metal Fatigue Part 1: Mean Strain Effects

Rubber Fatigue does not equal Metal Fatigue Part 1 Mean Strain Effects
Figure 1. Constant amplitude cycles at three different mean strains.

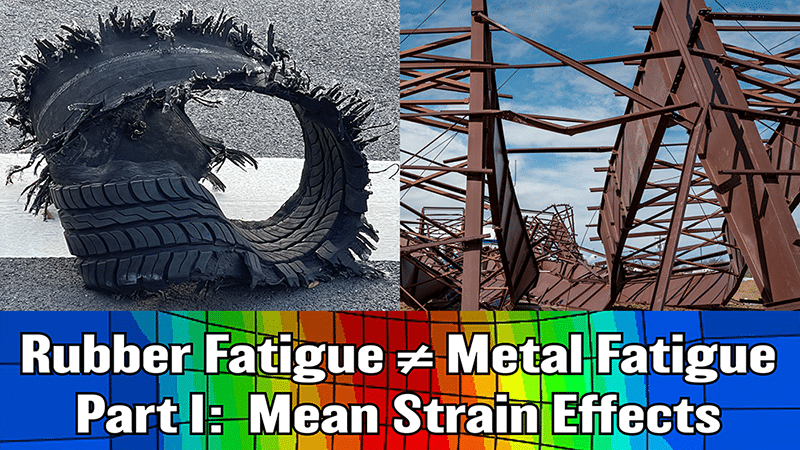
Rubber and metal are very different materials that exhibit very different behaviors.  Consider the effect of mean strain or stress on the fatigue performance of these materials.  Figure 1 illustrates a few typical constant amplitude strain cycles, each at a different level of mean strain.  If the stress amplitude is equal to the mean stress, we say that we have pulsating tension or fully relaxing tension.  If the mean stress is zero, we say that we have fully reversed tension/compression.  If the minimum stress is always positive, then we have nonrelaxing tension (i.e. always under load).  Nonrelaxing cycles are quite common in applications.  Examples include: pre-loads applied during installation; swaging of a bushing to induce compressive pre-stresses, interference fits, self-stresses occurring due to thermal expansion/contraction; and in tires, shape-memory effects of textile cords.

In metal fatigue analysis, it is customary to define the effect in terms of stress amplitude σa and mean stress σm, relative to the yield stress σy and the ultimate stress σu, as shown in Figure 2.  Below the fatigue threshold stress σ0, indefinite life is predicted. The Haigh (or Goodman)

Figure 2. Haigh diagram (left) and Wohler curves (right) showing mean strain effects on fatigue life for a metal.

diagram (left) maps fatigue life as a function of these parameters [1]. Wohler curves (right) provide similar information.  For metals, a simple rule may be applied universally: increasing mean strain is detrimental fatigue life.  It is also commonly assumed for metals that the critical plane is perpendicular to maximum principal stress direction.

There are many ways that rubber materials differ from metallic materials.  At the atomic scale, rubber is composed of long chain molecules experiencing constant thermal motion while interlinked with a permanent network topology.  This structure permits large, elastic/reversible straining to occur.  Metals could not be more different, existing as individual atoms packed into well-ordered crystals with occasional dislocations or lattice vacancies.  This structure permits only vanishingly small strains before inelastic deformation occurs.  At the meso scale, rubber is typically a composite material containing fillers such as carbon black, silica or clay, as well as other chemical agents.  The mesoscale of a metal is generally described in terms of crystalline grain boundaries and inclusions or voids.  Rubber exhibits many “special effects” that are not seen in metals: rate and temperature dependence, ageing, cyclic softening.  It is unsurprising that analysis methods for rubber differ substantially from those applied for metals.

Rubber’s fatigue performance has a more complex dependence on mean strain. For amorphous (ie non-crystallizing) rubbers, increasing mean strain reduces the fatigue life, as with metals.  But for rubbers that exhibit strain-induced crystallization, mean strain can greatly increase fatigue life, as illustrated in Figure 3.  Fatigue simulations therefore must take account of the strain crystallization effect.

Figure 3. Fatigue tests run in simple tension under constant amplitude show a significant increase in life for Natural Rubber (NR), which strain crystallizes, and a decrease of life for Styrene Butadiene Rubber (SBR) which is amorphous [2].
Mean strain effects are specified in the Endurica fatigue code in terms of fracture mechanical behavior, using the concept of an equivalent fully relaxing tearing energy Teq.  The tearing energy for fully relaxing conditions is said to be equivalent when it produces the same rate of crack growth as the nonrelaxing condition.  For amorphous rubbers, the equivalent R=0 tearing energy Teq is simply the range ΔT of the tearing energy cycle, which can be expressed in terms of the min and max tearing energies Tmin and Tmax, or in terms of R= Tmin / Tmax.  Plugging this rule into the power law crack growth rate function yields the well known Paris law, which predicts faster crack growth for increasing mean strain.  For a strain crystallizing rubber, the equivalent fully relaxing tearing energy can be specified using the Mars-Fatemi law.  In this case, the equivalent fully relaxing tearing energy depends on a function F(R), which specifies the crystallization effect in terms of its influence on the powerlaw slope of the crack growth rate law.  The relationship for amorphous and crystallizing rubbers are summarized in Table 1 [3,4].

Table 1.  Models for computing crack growth rate in amorphous and strain-crystallizing rubbers.

Rubber’s fatigue behavior may be plotted in a Haigh diagram, but the contours can be quite different than for metals.  In metal fatigue analysis, it is assumed that cracks always develop perpendicular to the max principal stress direction. This is not always true for rubber, especially in cases involving strain crystallization and nonrelaxing loads.  For rubber fatigue analysis it is therefore required to use critical plane analysis [5], in which fatigue life is computed for many potential crack orientations, and in which the crack plane with the shortest life is identified as the most critical plane.  Figure 4 shows the dependence of the fatigue life and the critical plane orientation on strain amplitude and mean strain.  A sphere is plotted for each pair of strain amplitude and mean strain coordinates, on which the colors represent fatigue life, and unit normal vectors indicate critical plane orientations.  It can be seen that different combinations of mean strain and strain amplitude can produce a range of crack plane orientations.

Figure 4. Critical plane analysis consists in integrating the crack growth rate law for every possible crack orientation, and identifying the orientation that produces the shortest life (left). Each point in the Haigh diagram (right) is associated with its own critical plane orientation.

The Haigh diagrams for natural rubber (NR) and for styrene butadiene rubber (SBR) are shown in Figure 5.  In these images, red represents short fatigue life, and blue long life.  For natural rubber (on the left), the long-life region of the Haigh diagram exhibits a notable dome-like shape, indicative of a beneficial effect of mean strain under the influence of strain-induced crystallization. In contrast, SBR always exhibits decreased fatigue life as mean strain increases.  Even so, the Haigh diagram for SBR has a nonlinear character associated with the material’s hyperelasticity that is also distinct from a metal.

Figure 5. Haigh diagrams computed for NR (left) and for SBR (right) rubbers.

It should be noted that the strain crystallization effect in rubber depends on temperature.  At colder temperatures, the effect is stronger, and at higher temperatures it is weaker.  Figure 6 compares experimental Haigh diagrams [6] (top) for a crystallizing rubber to computed results (bottom) for three temperatures.

Figure 6. Experimental Haigh diagram [6] for natural rubber at 3 temperatures (top), compared to computed Haigh diagram (bottom). Increasing temperature tends to reduce the beneficial effect of strain crystallization.
In summary, while tensile mean stresses are always detrimental in metals, in rubber they may be either beneficial or harmful, depending on whether the rubber can strain crystallize. The benefits of mean stresses in rubber can be quite strong – sometimes amounting to more than several orders of magnitude. The beneficial effect is stronger at colder temperatures and is reduced at higher temperatures.  Critical Plane Analysis is essential for accurately predicting the effects of strain crystallization in rubber.  Wohler curves, commonly used for metal fatigue analysis, incorrectly assume that the worst-case plane is always normal to the max principal stress direction.  This is not an accurate approach for strain crystallizing rubber under mean strain.  Use the Endurica fatigue solvers to accurately capture these effects when its important to get durability right!

References

[1] Stephens, R. I., Fatemi, A., Stephens, R. R., & Fuchs, H. O. (2000). Metal fatigue in engineering. John Wiley & Sons.

[2] Ramachandran, Anantharaman, Ross P. Wietharn, Sunil I. Mathew, W. V. Mars, and M. A. Bauman.  (2017) “Critical plane selection under nonrelaxing simple tension with strain crystallization.” In Fall 192nd technical meeting of the ACS Rubber Division, pp. 10-12.

[3] Mars, W. V. (2009). Computed dependence of rubber’s fatigue behavior on strain crystallization. Rubber Chemistry and Technology82(1), 51-61.

[4] Harbour, Ryan J., Ali Fatemi, and Will V. Mars. “Fatigue crack growth of filled rubber under constant and variable amplitude loading conditions.” Fatigue & Fracture of Engineering Materials & Structures 30, no. 7 (2007): 640-652.

[5] Mars, W. V. (2021). Critical Plane Analysis of Rubber. Fatigue Crack Growth in Rubber Materials: Experiments and Modelling, 85-107.

[6] Ruellan, Benoît, J-B. Le Cam, I. Jeanneau, F. Canévet, F. Mortier, and Eric Robin. “Fatigue of natural rubber under different temperatures.” International Journal of Fatigue 124 (2019): 544-557.


twitterlinkedinmail

2023 – a Year of Magnitude and Direction

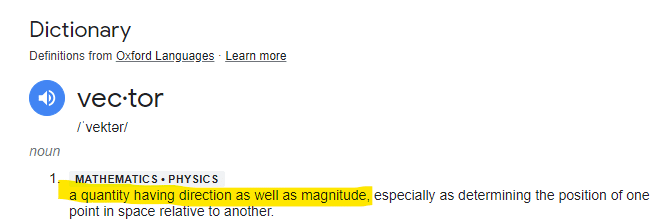
2023 marked year 15 for Endurica.  If I had to pick one word to describe the past year, that word would be “vector”.  Because magnitude and direction.  😊

We updated our core value statement this year.  The first one I ever wrote as part of Endurica’s original business plan listed 3 values: technical leadership, customer focus, and trustworthiness.  Those values served us well for many years and in many ways shaped who we have become.  But it was important this year to take stock again.  We’ve grown 8-fold since I wrote those down!  So our team spent many hours revisiting our shared values and deliberating over which will best define our culture and steer us right going forward.  In the end, we decided to keep the first 3, and we added 3 more:  embrace the grit, make an impact, and better every day.

We also completed an exercise to articulate what makes Endurica truly unique in the CAE / durability simulation space.  The 3 words we chose are… Accurate, Complete, and Scalable.

  • Accurate refers to the accurate material models that capture rubber’s many “special effects”, the accurate critical plane analysis method for analyzing multiaxial history, the accurate handling of nonlinear relationships between global input load channels and local crack experiences, and the extensive set of validation cases that have demonstrated our accuracy over the years. Nobody offers a more accurate solution for rubber durability.
  • Complete refers to our complete coverage of infinite life, safe life and damage tolerant approaches to testing and simulation. It refers to feature completeness that enables users to account for nearly any material behavior under nearly any service conditions.  Finally, it refers to the documentation, the materials database, and the examples we distribute with the software and with our webinar series.  Nobody offers a more complete solution for rubber durability.
  • Scalable refers to our capacity to apply our solutions efficiently in all circumstances. Scalability is the training we provide so that users can learn our tools quickly.  Scalability is access to powerful, ready-to-use workflows right when you need them.  Scalability is the modular approach we take to material testing and modeling so that simple problems can be solved cheaply and complex problems can be solved accurately in the same framework.  Scalability is our multi-threading that allows job execution time to be accelerated to complete impactful analysis on tough deadlines.  Nobody offers a more scalable solution for rubber durability.

2023 was not all navel-gazing and new marketing.  We also had magnitude and direction in other areas.

Top 10 Code Developments:

  1. New Endurica Architecture: After several years of development and a soft launch under the Katana project name, we finally completed our migration to the new architecture.  The new architecture provides a huge speed advantage for single thread and now for multithread execution. It uses a new input file format (.json). The json format makes it easier than ever for users to build customized and automated workflows via Python scripting.
  2. Sequence Effects: Sometimes the order of events matters to durability, and sometimes it doesn’t. We introduced Steps and Blocks to our input file, giving users complete control over the specification of multi-block, multi-step scheduling of load cases.  There is also a new output request that came out of this work: residual strength.
  3. EIE: 6 channels and support for RPC: Support for 6 channels of load input was one of our most highly requested new features.  Fast growing use of this feature led to further enhancements of the workflow (support for rpc file format, studies of map building techniques), and new recommendations on how to implement boundary conditions for specified rotation histories in explicit and implicit finite element models.
  4. Queuing: Design optimization studies need efficient management and execution of multiple jobs. Endurica’s software license manager now supports queueing for licenses. Queuing allows a submitted job to automatically wait to start until a license is available, instead of the prior behavior of exiting with a license error. Now you can submit many jobs without worrying about license availability.
  5. Haigh Diagram Improvements: We implemented an improved discretization of the Haigh diagram, and parallelized its evaluation. Now you get much nicer looking results in a fraction of the time. For details, check out our blog post on Haigh diagrams and also read about other improvements like axis limit setting and smoother contour plots.
  6. Viewer image copy: There is now a button! Its easier than ever to get your images into reports.
  7. Documentation Updates: We have been focusing on improving documentation this year. There are many new sections in the theory manual and user guide, as well as a getting started guide and more examples.  Stay tuned for many more examples coming in 2024!
  8. User Defined Planes: It is now possible to define your own set of planes for the critical plane search. One example where you might want to do this would be the situation where you would like to refine the critical plane search on a limited domain of the life sphere.
  9. New Database Materials: We added 7 new carbon black and silica filled EPDM compounds to the database. We are now up to 42 unique rubber compounds in the database.
  10. Uhyper Support: The new architecture now supports user-defined hyperelasticity. If you have a Uhyper subroutine for your finite element analysis, you can use it directly with Endurica.


Testing Hardware

We completed the acquisition and installation at ACE labs of a Coesfeld Instrumented Cut and Chip Analyser (ICCA).  The ICCA provides unmatched measurement and control of impact conditions, and provides a way to evaluate rubber compounds for their resistance to cutting and chipping.


Applications, Case Studies, Webinars

Never underestimate the students! We were blown away by the work of undergraduates at the University of Calgary with our tools and Ansys.  The students designed an airless tire, completing durability simulations using Endurica software within the scope of a senior design project. They were able to Get Durability Right on a short timeline and a student budget. Check out their multi-objective, high-performance design project here.

Analyzing what happens to tires as they take on the most celebrated testing track in the world might have been the funnest project Endurica’s engineers tackled in 2023. We presented the technical details at The Tire Society annual meeting and more in a followup webinar. An extensive Q&A session followed, and I loved the final question: “So, how long before we have a dashboard display of ‘miles to tire failure’ in our cars?”  Bring it.  We are ready!

Our Winning on Durability webinar series hit a nerve with the Metal Fatigue DOES NOT EQUAL Rubber Fatigue episodes on mean strain (the tendency of larger mean strains to significantly INCREASE the fatigue life of some rubbers!) and linear superposition (for converting applied load inputs to corresponding stress/strain responses). The great response has lead to our third installment on the differences between rubber and metal fatigue with an upcoming presentation on temperature effects.

twitterlinkedinmail

Latest Addition: the Coesfeld Instrumented Chip & Cut Analyser

When there is rolling or sliding contact of a rubber surface over a second hard surface of sufficient roughness, localized cutting and damage of the rubber surface sometimes becomes a problem.  It occurs in off-road tires operating on stony surfaces, for example, and it can severely limit the useful life of a tire.  In order to study this “cutting and chipping” failure mode, Endurica last month acquired a new testing instrument: the Coesfeld Instrumented Chip & Cut Analyser (or ICCA).  It has been set up at partner lab ACE Laboratories, commissioned, and it is now ready for running tests.

The ICCA test uses a solid rubber wheel specimen.  These are molded from uncured rubber compound supplied by the client.  Alternatively, the mold can be rented if the client prefers to produce their own specimens.  The ICCA test offers direct control and measurement of the following key parameters

  • Wheel revolution speed
  • Overall impact period, tP
  • Peak impact force, FD
  • Contact duration of impact, tD

Figure 1.  Contact force control signal (left).  Coesfeld ICCA impactor tool actuation (right).

It also records the following measurements

  • Normal force
  • Normal displacement
  • Friction force
  • Friction displacement (i.e. wheel rotation)
  • Abrasion depth

Figure 2.  Normal and friction impact forces and displacements during a single impact.

The Coesfeld ICCA instrument improves on J. R. Beatty’s 1979 “BF Goodrich Cut and Chip” (BFG) test in several ways.  Perhaps the chief improvement is that the force and duration of the impact are accurately controlled and measured.  The BFG test suffers from two major problems: 1) that the impact is passively applied by means of a weighted beam whose natural impact frequency is influenced by the stiffness of the rubber compound, and 2) that the impact forces and displacement are not measured and not easily relatable to applications.  By quantifying the impact conditions of the test, the Coesfeld ICCA offers the opportunity to match those of the actual application.

As the Americas distributor for Coesfeld testing instruments, Endurica is proud and excited to add the Coesfeld ICCA to our portfolio of testing services and testing instruments.  Reach out to us today if you have a need for testing services on the ICCA, or if you would like to bring the Coesfeld ICCA to your lab.

Figure 3.  Endurica President Will Mars and Vice President Tom Ebbott with the newly installed Coesfeld ICCA at partner ACE Laboratories.

twitterlinkedinmail

Tolerances in Fatigue Life Prediction with Endurica

I get this question a lot: how well can the Endurica software predict fatigue life?  Is it as good as a metal fatigue code, where a factor of 2x is often quoted as a target tolerance?

The answer is yes, fatigue life predictions can reach and beat this level of accuracy. But as always, knowledge and control of the problem at hand is key.  We must keep in mind that fatigue behavior varies on a logarithmic scale.  It depends on many variables.  It depends on how failure is defined in the simulation and in the test.  Small variations of an input may lead to large variations of the fatigue life.  So, to achieve the best tolerances, careful specification, measurement, and control are required of both simulation and test.

Analysis tolerances depend on whether the analysis workflow is “open loop” or “closed loop”.  In an open loop workflow, the analyst is typically in the position of having to accept without question the as-given material properties, geometry, boundary conditions and load history.  The analysis is completed and reported.  Decisions are made and life goes on.  In a closed loop workflow, there are additional steps.  These include a careful review of differences between the test and the simulation, as well as identification and correction of any erroneous assumptions (about material properties, geometry, boundary conditions, and load history).

Open loop workflows produce larger tolerances.  Every situation is different, but do not expect tolerances tighter than perhaps a factor of 3x-10x in life, when working in open loop mode.  There is just too much sensitivity, too many variables, and too little control in this mode.  The open loop mode does have a few advantages though.  It takes less work, less time, less cost.  And it is often useful for ranking alternatives (ie A vs. B comparisons).

For high accuracy, a closed loop workflow is required.  It is rarely the case that initial assumptions are sufficiently error-free to support tight tolerances on fatigue life prediction.  Therefore, careful measurement and validation of material property inputs, part dimensions, load-deflection behavior, pre-stresses, etc. should be made.  Where gaps are found between test and simulation, appropriate amendments to the test and/or to the simulation should be adopted.  This approach yields high confidence in the simulation results, and good accuracy in fatigue life predictions.  We have seen users hit life predictions to better than a factor of 1.1x with this approach!  Although this approach requires more effort, it results in more complete mastery of part design, and it yields a much stronger starting position for subsequent products.

While “right the first time” engineering is possible with either open or closed loop, the closed loop approach benefits from progressive refinement of the analysis inputs and it ultimately gives the highest success rate.


twitterlinkedinmail

Defining the Temperature Dependence of Strain Crystallization in Endurica

Crystallization requires the suppression of molecular mobility, which in natural rubber can happen either by reducing the temperature or by increasing the strain.  Crystallization of natural rubber can be extremely beneficial to durability.  Nonrelaxing conditions (ie R>0) can increase life by factors of more than 100!  So, what happens if you have both high mean strain and high temperature?

This was the question studied in 2019 by Ruellan et al.  They constructed Haigh diagrams for a filled natural rubber at 3 temperatures: 23 degC, 90 degC and 110 degC.  They completed a large experimental study using dumbbell shaped specimens with a matrix consisting of approximately 4 R ratios x 4 amplitudes x 3 temperatures = 48 conditions.  Their results show that the increase of fatigue life with increasing mean strain at constant amplitude disappears as temperature is increased.  In particular, notice how at 23 degC each life contour (shown in red) has a strongly defined minimum force amplitude that lies near the R=0 line.  Also notice how, at higher temperatures, the life contours start to reflect a decrease of life with increasing mean strain.

This interesting effect can easily by replicated in the Endurica fatigue solver by letting the strain crystallization effect depend on temperature.  The material definition we have used in this quick demo is given below in both the old hfi format and the new Katana json format.  I have highlighted in yellow those parts of the definition which reflect the temperature dependence.

In the material definition, we have reflected two behaviors:

  1. the increase of crack growth rate with temperature (ie the RC parameter), and
  2. the decrease of strain crystallization with temperature (ie the Mars-Fatemi exponential strain crystallization parameter FEXP).

We have plotted the resulting Haigh diagrams in the Endurica viewer, and directly overlaid Ruellan’s results for comparison.  Although the x and y scales in Ruellan’s results are shown in terms of total specimen force and ours are shown in terms of strain, a quite satisfying match is nonetheless achieved for the interaction of temperature with the mean strain effect.  It is especially satisfying that such rich behavior is so compactly and so accurately described by means of the Mars-Fatemi crystallization parameter.

twitterlinkedinmail

The View on ‘22 – The Top 10 Happenings for Endurica in 2022

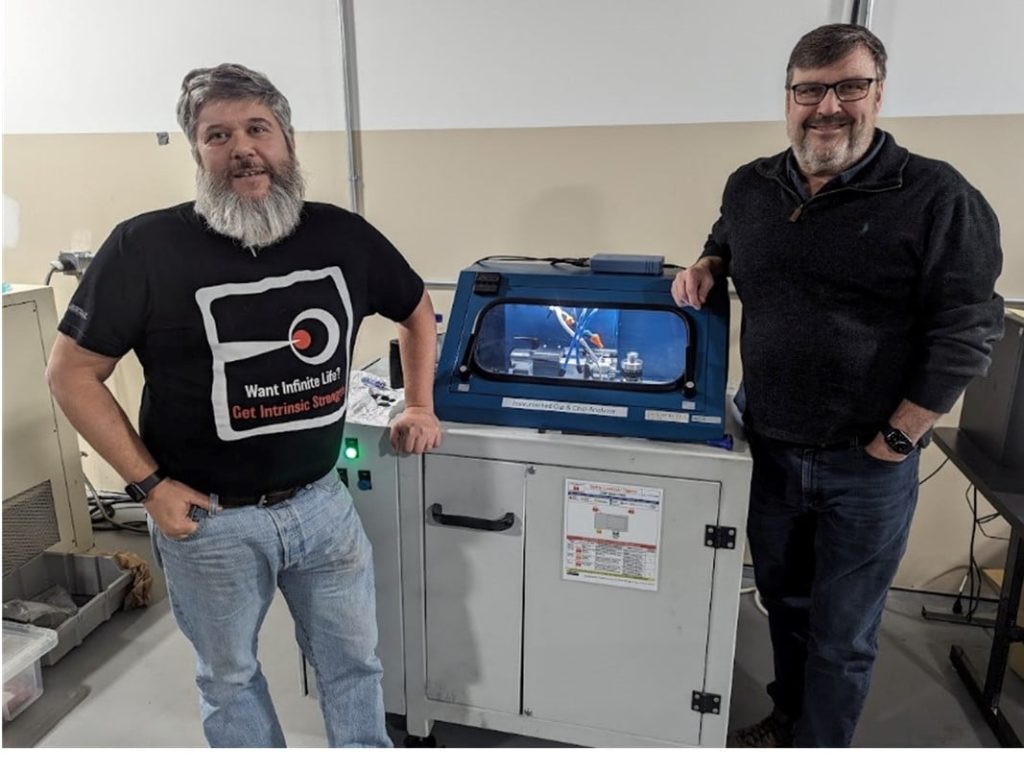
  1. Expanded our team! We welcomed 35-year Goodyear veteran Tom Ebbott to our team as Vice President, and at one point we had 3 interns working with us this year.  It wasn’t all hard work – we enjoyed our first company canoe trip / picnic in July.
  2. Solved much bigger problems. We set a record this summer for the largest rubber fatigue analysis ever. Ford Motor Company gave us multi-channel recorded road load histories from the full schedule of 144 distinct test track events that they use to qualify a motor mount for durability. We used Endurica EIE to map the load space and generate 3.2 Terabytes of stress-strain history for fatigue analysis. The new Katana multi-threading architecture of our Endurica CL fatigue solver enabled us to process 152k elements through all 15,693,824 timesteps of the schedule.  Check out our presentation at RubberCon 23 in Edinborough UK.
  3. Made analysis of block cycles easier. The Endurica CL and DT solvers’ Katana architecture now enables multiple blocks of load history to be specified in a single analysis.WoD 6 - Strain Crystallization
  4. Added a Haigh diagram visualization to the Endurica Viewer. Use it to quickly understand your material’s dependence of fatigue life on mean strain and strain amplitude.
  5. Implemented a channel reduction algorithm to Endurica EIE. It will analyze your multi-channel loading history to check for opportunities to reduce the dimensionality of your analysis through a change of coordinate basis.  Often, a 6-channel signal can be reduced to 3, 4 or 5 channels, greatly reducing computational requirements for building the map for EIE’s interpolation process.
  6. Expanded our licensing model to offer local, regional and global options. If your organization uses Endurica at multiple sites around the world, ask us about the advantage of regional or global licenses. These licenses allow any number of users to share a pool of solver threads for maximum flexibility and compute power.
  7. Added an experimental characterization for ozone cracking. Ozone is a trace gas that strongly reacts with some rubbers to produce surface cracking. It limits useful product life, even for loads below the fatigue threshold.Ozone Module. quantify ozone attack critical energy and rate Our testing method gives you the parameters you need to set up the ozone attack model in your Endurica CL / DT analyses. Perfect for analysis of tire sidewall endurance.
  8. Were honored when our founder and president, Will Mars, received the Herzlich Medal – the highest award in the tire industry – at the International Tire Exhibition and Conference. This honor is bestowed every other year to recognize an individual whose career and accomplishments have changed the tire industry for the better and left a lasting impact on tire design, development and manufacturing.
  9. Strengthened our documentation. New and experienced users alike will find it easier than ever to find the theory, procedures and examples that will yield rapid success in applying our software workflows. Check out the new sections on Mullins Effect, Ageing, Safety Factor, and Block Cycle analysis.
  10. Celebrated our client’s success. Technetics Group (Pierrelatte, France Maestral® R&D Sealing Laboratory) and Delkor Rail (New South Wales, Australia) shared their Winning on Durability success in case studies.
twitterlinkedinmail

Necessity and Invention: Getting Durability Right and Winning

Will Mars Delivering Keynote Presentation as Herzlich Medal Winner 2022

William V. Mars, Ph.D., P.E.
2022 Harold Herzlich Award Winner
Acceptance Speech
at ITEC 2022, Akron, Ohio on 15 September 2022

Three key takeaways from our founder’s acceptance speech of the tire industry’s highest award.

  1.  There is a point at which commercial simulation code outcompetes internally developed simulation code. Will talks about how this played out in the early days of finite element technology in the tire industry, and how the lessons learned apply to durability simulation today.
  2. Traditional is not the same as conservative. Will talks about the tension between the tire industry’s conservatism and the necessities that drive its progress, and how Endurica navigated its entry to the industry with its disruptive technology.
  3. The industry is going through a transition from scientific discovery and invention towards the empowerment of product developers to leverage advances in durability simulation. Will talks about the integration of testing and simulation workflows, and some of the capabilities that open new channels for gaining competitive advantage.

Check out the full talk here to enjoy some fun insights about Will’s personal journey through the years.


twitterlinkedinmail

Tension / Compression Cycles, R ratio and a Discussion of Wohler Curve for Rubber

Fatigue Life of Rubber with different strain constraints

In fatigue testing, R is the ratio of the minimum to the maximum occurring during one period of a cycle.  If the mean value is zero (ie the cycle is centered on zero), then the minimum is equal and opposite in sign to the maximum.  In this case, we say that R=-1.  The cycle can be defined by various parameters.  If we define R in terms of the stress or the strain, then R may take either positive or negative values.  We might hear, for example, that R=-1 uniaxial loading is a symmetric tension / compression cycle.

Be careful about definitions, however! The Endurica material models define R in terms of the tearing energy (ie T = – dU/dA, where T is the tearing energy, U is the elastic potential energy and A is the crack area).  The tearing energy is the driving force responsible for crack growth.  It is always greater than or equal to zero.  When R is defined in terms of tearing energy, its range is 0 ≤ R ≤ 1.

This leads to the following question that we often hear:  how can Endurica compute fatigue in compression if it does not admit a negative R ratio?

Let’s look at a series of signals, all having the same strain amplitude, and each with a different mean strain.  We will set the mean strain so that it is at most equal to the amplitude (corresponding to fully relaxing R=0 tension), and at least equal to the negative of the amplitude (corresponding to fully relaxing R=0 compression).  In the middle of the range, we have fully reversed tension/compression (what some call “R=-1” loading when defining R in terms of strain).  The principal engineering strains are plotted below for each case.  This gives a smooth progression from a cycle that is only compression to a mixed cycle with both tension and compression and finally to a cycle that is only tension.

Series of signals with same strain amplitude but different Tension/Compression levels

Even for these simple uniaxial cases, the critical plane for simple compression is not the same as the critical plane for simple tension.  In simple compression, due to crack closure, the critical plane is the plane that maximizes shearing.  These planes make a 45-degree angle with the axis of loading (x direction).  In simple tension, however, the critical plane is perpendicular to the load (x direction).  In the figure below, the change in the critical plane as the mean strain increases from compression to tension is evident.  On each sphere, the arrows indicate the perpendicular of a critical plane.

Mean strain increase as compression to tension is evident with change in the critical plane

The next figure shows the cracking energy density (units of mJ/mm3, and proportional to tearing energy) as a function of time on the critical plane for each case.  The symbols on each line indicate the times at which the identified crack plane is open or closed.  Now we can see clearly that fully reversed tension/compression (ie “R=-1” loading in terms of strain) is really R=0 when viewed in terms of tearing energy on the critical plane.

Graphs showing the cracking energy density as a function of time on the critical plane. Fully reversed tension/compression is really R=0 when viewed in terms of tearing energy.

The computed fatigue life is given in the last figure for each case using this material definition:

MAT=RUBBER
ELASTICITY_TYPE=ARRUDABOYCE
SHEAR_MODULUS=1 ! MPa
LIMIT_STRETCH=4
BULK_MODULUS=3000 ! MPa
FATIGUE_TYPE=THOMAS
FLAWSIZE=0.025 ! mm
FLAWCRIT=1 ! mm
TCRITICAL=10 ! kJ/m^2
RC=3.42E-2 ! mm/cyc
F0=2
X(R)=LINDLEY73

The computed fatigue life depending on different percentages of tension/compression

The moral of the story:

  1. Fully reversed tension/compression cycles (“R=-1” in stress or strain terms) are really fully relaxing cycles (R=0 in tearing energy terms) from the perspective of the crack precursor on the critical plane.
  2. The critical plane depends on whether you have tension or compression. Wohler curve analysis completely misses the fact that the failure plane is not always perpendicular to the loading direction!
  3. A simple sinusoidal history that crosses through zero results in separate tension and compression events, each of which has its own peak and valley, and each of which influences the critical plane selection. Wohler curve analysis based on max principal stress or strain amplitude completely misses these physics.
twitterlinkedinmail

Busting Myths About Endurica

Myths vs Facts on Endurica, Test your knowledge about Endurica

True or False? Test your knowledge about Endurica

Endurica is only a software company.
False. While Endurica is perhaps best known for its game-changing fatigue solver software, we also deliver industry-leading testing services, testing instruments, and training.  If you need durability for elastomers, we are uniquely positioned to bring you winning capabilities.

Endurica is used by the majority of top rubber product makers.
True.  As of the 2021 Rubber News global rankings report, 6 of the top 9 global rubber product makers are using Endurica solutions to characterize and simulate durability.

Endurica invented Critical Plane Analysis.
False, but...  Critical Plane Analysis – the technology that gives best accuracy fatigue life predictions under complex multiaxial loading – was originally pioneered by the metals fatigue community.  But Endurica does hold the patent on the first Critical Plane Analysis algorithm suitable for elastomers, and we are the world leaders in making the technology available to product developers.

Wohler curve based methods are just as accurate and competitive as Endurica’s Critical Plane / Fracture Mechanics-based method.
False. Wohler curve based methods suffer from many problems that are solved by the Critical Plane Method.  1) they often assume a wrong crack orientation rather than searching for the most damaging scenario, 2) they do not account properly for mode of deformation effects, 3) the testing program required to populate a Wohler curve scales poorly and has poor repeatability.

I don’t need Endurica software if I already have a metal fatigue code (nCode DesignLife, FEMFAT, MSC Fatigue, and fe-safe).
False. Metals and elastomers have completely distinct molecular structures and behaviors.  While metals operate at small strain, elastomers tend to operate at large strain.  Where metals exhibit linear elasticity, elastomers exhibit nonlinear behavior.  Using a metal fatigue code for analyzing elastomer fatigue is like trying to use a car as a boat: you can certainly drive the car into the water, but you end up on the bottom of the lake.

Endurica solvers work with Ansys, Simulia, and Hexagon simulation platforms
True. We maintain software development partnerships with the major finite element software vendors so that we can offer easy to use pre-and post- integrations with Ansys, Abaqus, and MSC/Marc.  You can use the Endurica workflows with the finite element code that works for you.  We also develop the fe-safe/Rubber plugin.

Everyone knows you can simulate durability.
False. We’re always surprised by the number of people at conferences and trade shows who don’t know that simulating the durability of rubber is even possible.  Our tools simulate everything from basic constant amplitude cyclic loading, to variable amplitude, multiaxial loading (up to 6 input channels!), ageing, strain crystallization, ozone attack, cyclic softening, creep crack growth, self-heating, block cycle schedules, residual life.  Our multi-threading capabilities mean that large jobs can execute quickly.  Our solvers are fast enough to compute damage in real-time for a full finite element model!

Endurica solutions have had significant commercial impact.
True.  Endurica was founded in 2008 to reduce rubber product launch cost and risk and we have saved our clients millions of dollars.  Endurica’s impact was recognized with the prestigious U.S. Small Business Administration Tibbetts award.

twitterlinkedinmail

My SAE WCX 2022 Top Takeaway


SAE WCX | Detroit, Michigan | April 5-7, 2022

There were several papers on fatigue life prediction for elastomers at SAE WCX 2022, but the highlight for us was this one from Automotive OEM Stellantis: “Fatigue Life Prediction and Correlation for Powertrain Torque Strut Mount Elastomeric Bushing Application” by Dr. Touhid Zarrin-Ghalami, Durability Technical Specialist at FCA US LLC Fiat Chrysler Automobiles logowith coauthors C Elango, Sathish Kumar Pandi, and Roshan N. Mahadule from FCA Engineering India Pvt, Ltd.  Check out the abstract or buy the paper here…

The study shows that very accurate fatigue life prediction results are possible for elastomeric components under block cycle loading using Critical Plane Analysis.  A key feature of the analysis is the characterization and modeling of rubber’s hyperelastic properties, fatigue crack growth properties, crack precursor size, and strain crystallization behavior.  Careful measurement of these analysis ingredients led to a nearly perfect correlation of the predicted life (520 blocks) with the tested life (523 blocks, average of 4 replicate tests), and of predicted failure mode with observed failure mode.

Endurica users like Stellantis are developing a solid track record of routine and successful fatigue life prediction.  We soon expect to see the day when CAE fatigue life prediction for rubber components is regarded as obligatory, given the risk and cost avoided with “right the first time” engineering.

Congratulations to the Stellantis team on this impressive success!

 Fatigue Life (block) demonstrating the accuracy of the CAE Virtual Simulation compared to a physical test

Citation: Elango, C., Pandi, S.K., Mahadule, R.N., and Zarrin-Ghalami, T., “Fatigue Life Prediction and Correlation of Engine Mount Elastomeric Bushing using A Crack Growth Approach,” SAE Technical Paper 2022-01-0760, 2022, doi:10.4271/2022-01-0760.

twitterlinkedinmail
close
Trial License RequestTrial License RequestTrial License RequestTrial License RequestTrial License Request

Our website uses cookies. By agreeing, you accept the use of cookies in accordance with our cookie policy.  Continued use of our website automatically accepts our terms. Privacy Center