Tension / Compression Cycles, R ratio and a Discussion of Wohler Curve for Rubber

Fatigue Life of Rubber with different strain constraints

In fatigue testing, R is the ratio of the minimum to the maximum occurring during one period of a cycle.  If the mean value is zero (ie the cycle is centered on zero), then the minimum is equal and opposite in sign to the maximum.  In this case, we say that R=-1.  The cycle can be defined by various parameters.  If we define R in terms of the stress or the strain, then R may take either positive or negative values.  We might hear, for example, that R=-1 uniaxial loading is a symmetric tension / compression cycle.

Be careful about definitions, however! The Endurica material models define R in terms of the tearing energy (ie T = – dU/dA, where T is the tearing energy, U is the elastic potential energy and A is the crack area).  The tearing energy is the driving force responsible for crack growth.  It is always greater than or equal to zero.  When R is defined in terms of tearing energy, its range is 0 ≤ R ≤ 1.

This leads to the following question that we often hear:  how can Endurica compute fatigue in compression if it does not admit a negative R ratio?

Let’s look at a series of signals, all having the same strain amplitude, and each with a different mean strain.  We will set the mean strain so that it is at most equal to the amplitude (corresponding to fully relaxing R=0 tension), and at least equal to the negative of the amplitude (corresponding to fully relaxing R=0 compression).  In the middle of the range, we have fully reversed tension/compression (what some call “R=-1” loading when defining R in terms of strain).  The principal engineering strains are plotted below for each case.  This gives a smooth progression from a cycle that is only compression to a mixed cycle with both tension and compression and finally to a cycle that is only tension.

Series of signals with same strain amplitude but different Tension/Compression levels

Even for these simple uniaxial cases, the critical plane for simple compression is not the same as the critical plane for simple tension.  In simple compression, due to crack closure, the critical plane is the plane that maximizes shearing.  These planes make a 45-degree angle with the axis of loading (x direction).  In simple tension, however, the critical plane is perpendicular to the load (x direction).  In the figure below, the change in the critical plane as the mean strain increases from compression to tension is evident.  On each sphere, the arrows indicate the perpendicular of a critical plane.

Mean strain increase as compression to tension is evident with change in the critical plane

The next figure shows the cracking energy density (units of mJ/mm3, and proportional to tearing energy) as a function of time on the critical plane for each case.  The symbols on each line indicate the times at which the identified crack plane is open or closed.  Now we can see clearly that fully reversed tension/compression (ie “R=-1” loading in terms of strain) is really R=0 when viewed in terms of tearing energy on the critical plane.

Graphs showing the cracking energy density as a function of time on the critical plane. Fully reversed tension/compression is really R=0 when viewed in terms of tearing energy.

The computed fatigue life is given in the last figure for each case using this material definition:

MAT=RUBBER
ELASTICITY_TYPE=ARRUDABOYCE
SHEAR_MODULUS=1 ! MPa
LIMIT_STRETCH=4
BULK_MODULUS=3000 ! MPa
FATIGUE_TYPE=THOMAS
FLAWSIZE=0.025 ! mm
FLAWCRIT=1 ! mm
TCRITICAL=10 ! kJ/m^2
RC=3.42E-2 ! mm/cyc
F0=2
X(R)=LINDLEY73

The computed fatigue life depending on different percentages of tension/compression

The moral of the story:

  1. Fully reversed tension/compression cycles (“R=-1” in stress or strain terms) are really fully relaxing cycles (R=0 in tearing energy terms) from the perspective of the crack precursor on the critical plane.
  2. The critical plane depends on whether you have tension or compression. Wohler curve analysis completely misses the fact that the failure plane is not always perpendicular to the loading direction!
  3. A simple sinusoidal history that crosses through zero results in separate tension and compression events, each of which has its own peak and valley, and each of which influences the critical plane selection. Wohler curve analysis based on max principal stress or strain amplitude completely misses these physics.
twitterlinkedinmail

Does hydrostatic loading cause fatigue damage in rubber?

Hydrostatic

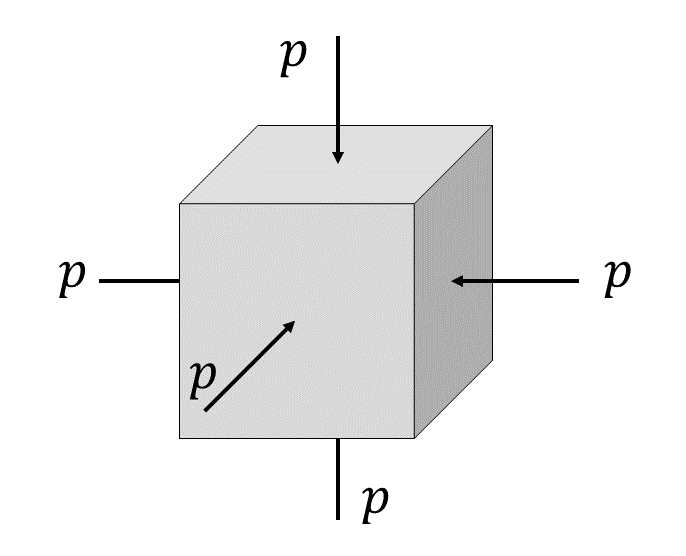
A question was recently put to us regarding the effects of cyclic hydrostatic loading on rubber.  In hydrostatic loading, no shearing stresses are present, and the 3 principal stresses all have the same value p.  For this case, all 3 Mohr’s circles degenerate to a single point on the normal stress axis.

 Mohr’s circles degenerate to a single point for the case of compressive hydrostatic pressure.

Figure 1. Mohr’s circles degenerate to single point for the case of compressive hydrostatic pressure.

Under dynamic hydrostatic loading, the point may move along the normal stress axis in either of the tensile (p>0) or compressive directions (p<0).  When we have pure hydrostatic compression, cracks in all orientations are closed with a tearing energy of zero.  We expect infinite fatigue life in this case.  On the other hand, when we have hydrostatic tension, growth of a crack will release energy, and so the tearing energy is positive. We then expect crack growth to occur at a rate determined by the tearing energy.  Endurica estimates tearing energy T via the following rule:

T = 2 πWC a

in which a is the size of the crack, and Wc is the cracking energy density. For a slightly compressible material under hydrostatic loading, the cracking energy density calculation becomes

WC = ∫ pd ε 𝜀

and, remembering that for volumetric deformation, the linear strain is 1/3 of the volumetric dilatation, we finally obtain

WC = 1/3 ∫ pd ε v = 1/3 W

where W is the dilatational strain energy density.


So let’s compute an example using the following material definition:

 Computation using different materials

Let’s compute 8 different fully relaxing hydrostatic loading cases: 4 in hydrostatic compression, 4 in hydrostatic tension.  We’ll take these loaded extreme strain levels: -10%, -5%, -2%, -1%, 1%, 2%, 5%, 10%, which correspond to extreme dilatations of -27%, -14%, -6%, -3%, 3%, 6%, 16%, 33%.

As a first check, we plot the hydrostatic pressures computed for each case.  The slope of the line is 3000 MPa, which agrees with the assigned bulk modulus.

 Plot of the hydrostatic pressures computed for each case

Figure 2. Computed volume strain – hydrostatic pressure relationship.

Next, we compute the strain energy density and the cracking energy density for each case.  As expected, we verify that for p<0, crack closure results in CED=0, and for p>0, CED=SED/3.

Comparison of strain energy density and cracking energy density for hydrostatic compression and tension.

Figure 3. Comparison of strain energy density and cracking energy density for hydrostatic compression and tension.

Finally, we compute the fatigue life for each case.  In all cases, we see that the damage sphere is uniform over its entire surface, indicating that all possible crack orientations receive equal damage.  We also see that for cases involving hydrostatic compression, life is essentially infinite.  For cases involving hydrostatic tension, we verify that finite life is predicted, with shorter life at higher hydrostatic tension, as expected.

 Predicted life and damage sphere for compressive and tensile hydrostatic loading.

Figure 4.  Predicted life and damage sphere for compressive and tensile hydrostatic loading.

In summary, we have verified that the Endurica fatigue solver behaves as follows with respect to hydrostatic loading:

  • In hydrostatic compression, no damage accrues, and life is indefinite.
  • In hydrostatic tension, crack growth is predicted, with shorter fatigue life for higher values of tension. The cracking energy density is 1/3 of the strain energy density for hydrostatic tension.
  • For all hydrostatic cases, there is no single preferred critical plane. Rather, all planes show equal potential for crack development.
twitterlinkedinmail
close
Trial License RequestTrial License RequestTrial License RequestTrial License RequestTrial License Request

Our website uses cookies. By agreeing, you accept the use of cookies in accordance with our cookie policy.  Continued use of our website automatically accepts our terms. Privacy Center