Tension / Compression Cycles, R ratio and a Discussion of Wohler Curve for Rubber
In fatigue testing, R is the ratio of the minimum to the maximum occurring during one period of a cycle. If the mean value is zero (ie the cycle is centered on zero), then the minimum is equal and opposite in sign to the maximum. In this case, we say that R=-1. The cycle can be defined by various parameters. If we define R in terms of the stress or the strain, then R may take either positive or negative values. We might hear, for example, that R=-1 uniaxial loading is a symmetric tension / compression cycle.
Be careful about definitions, however! The Endurica material models define R in terms of the tearing energy (ie T = – dU/dA, where T is the tearing energy, U is the elastic potential energy and A is the crack area). The tearing energy is the driving force responsible for crack growth. It is always greater than or equal to zero. When R is defined in terms of tearing energy, its range is 0 ≤ R ≤ 1.
This leads to the following question that we often hear: how can Endurica compute fatigue in compression if it does not admit a negative R ratio?
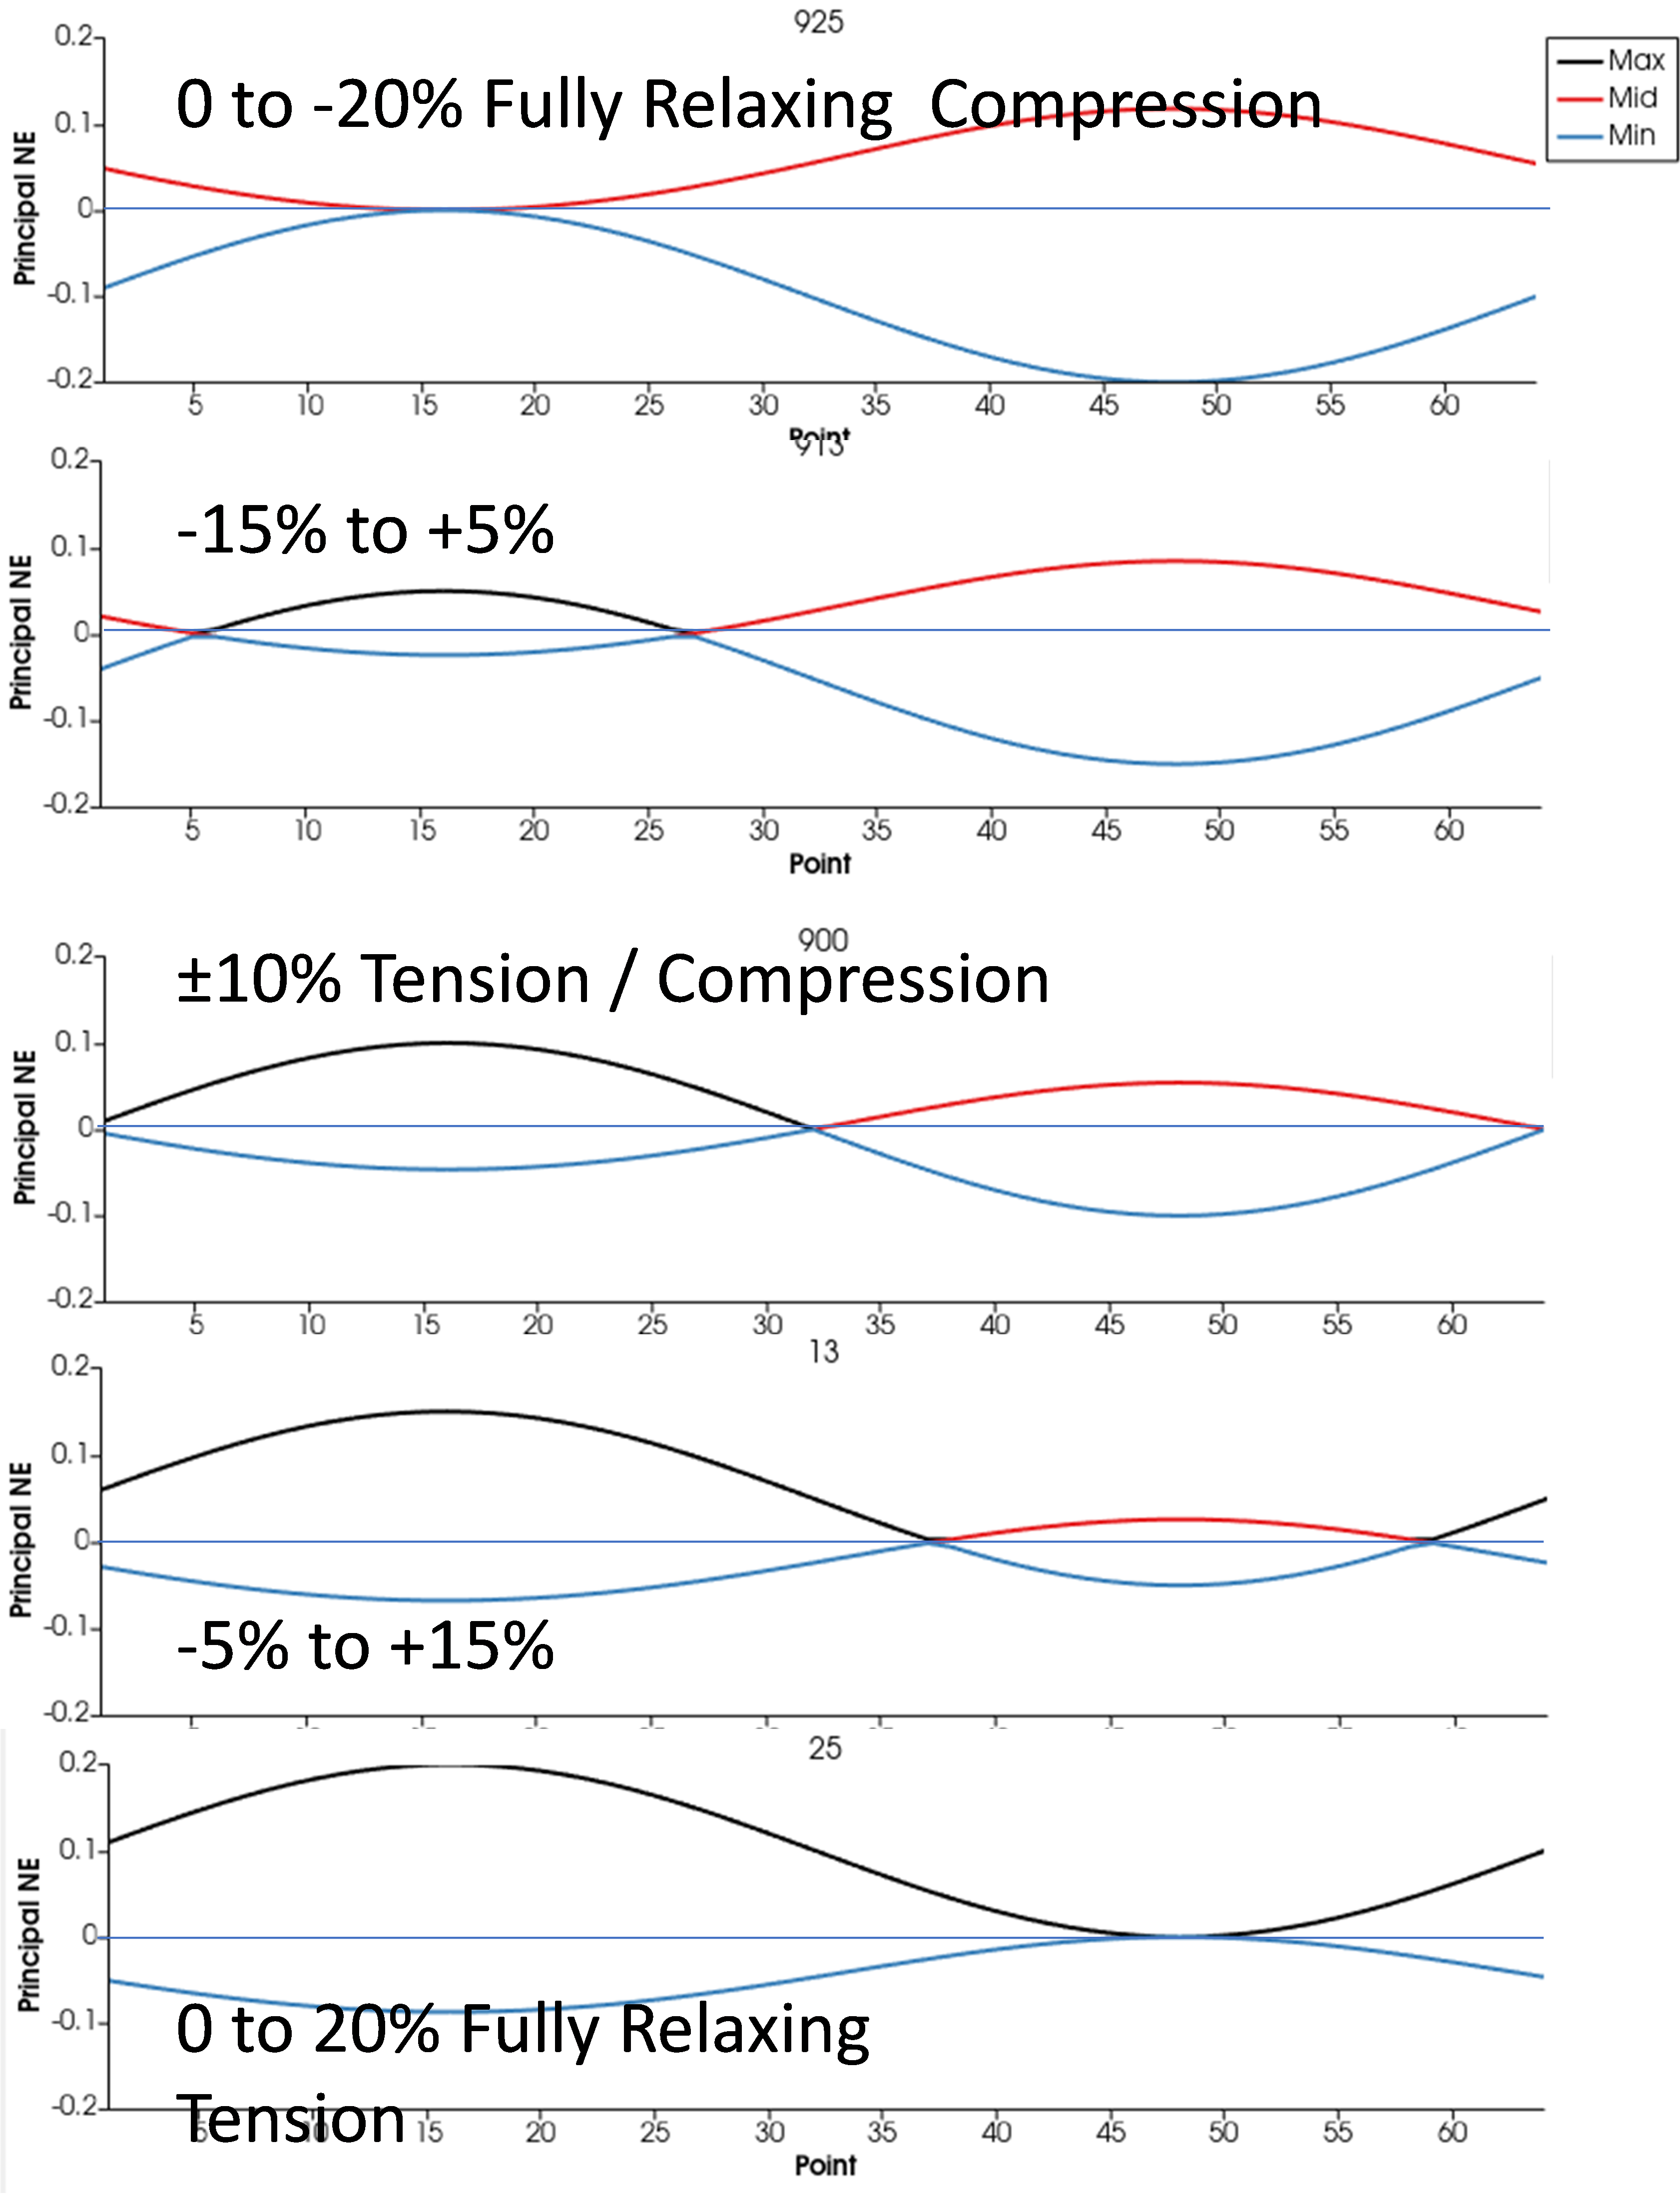
Let’s look at a series of signals, all having the same strain amplitude, and each with a different mean strain. We will set the mean strain so that it is at most equal to the amplitude (corresponding to fully relaxing R=0 tension), and at least equal to the negative of the amplitude (corresponding to fully relaxing R=0 compression). In the middle of the range, we have fully reversed tension/compression (what some call “R=-1” loading when defining R in terms of strain). The principal engineering strains are plotted below for each case. This gives a smooth progression from a cycle that is only compression to a mixed cycle with both tension and compression and finally to a cycle that is only tension.
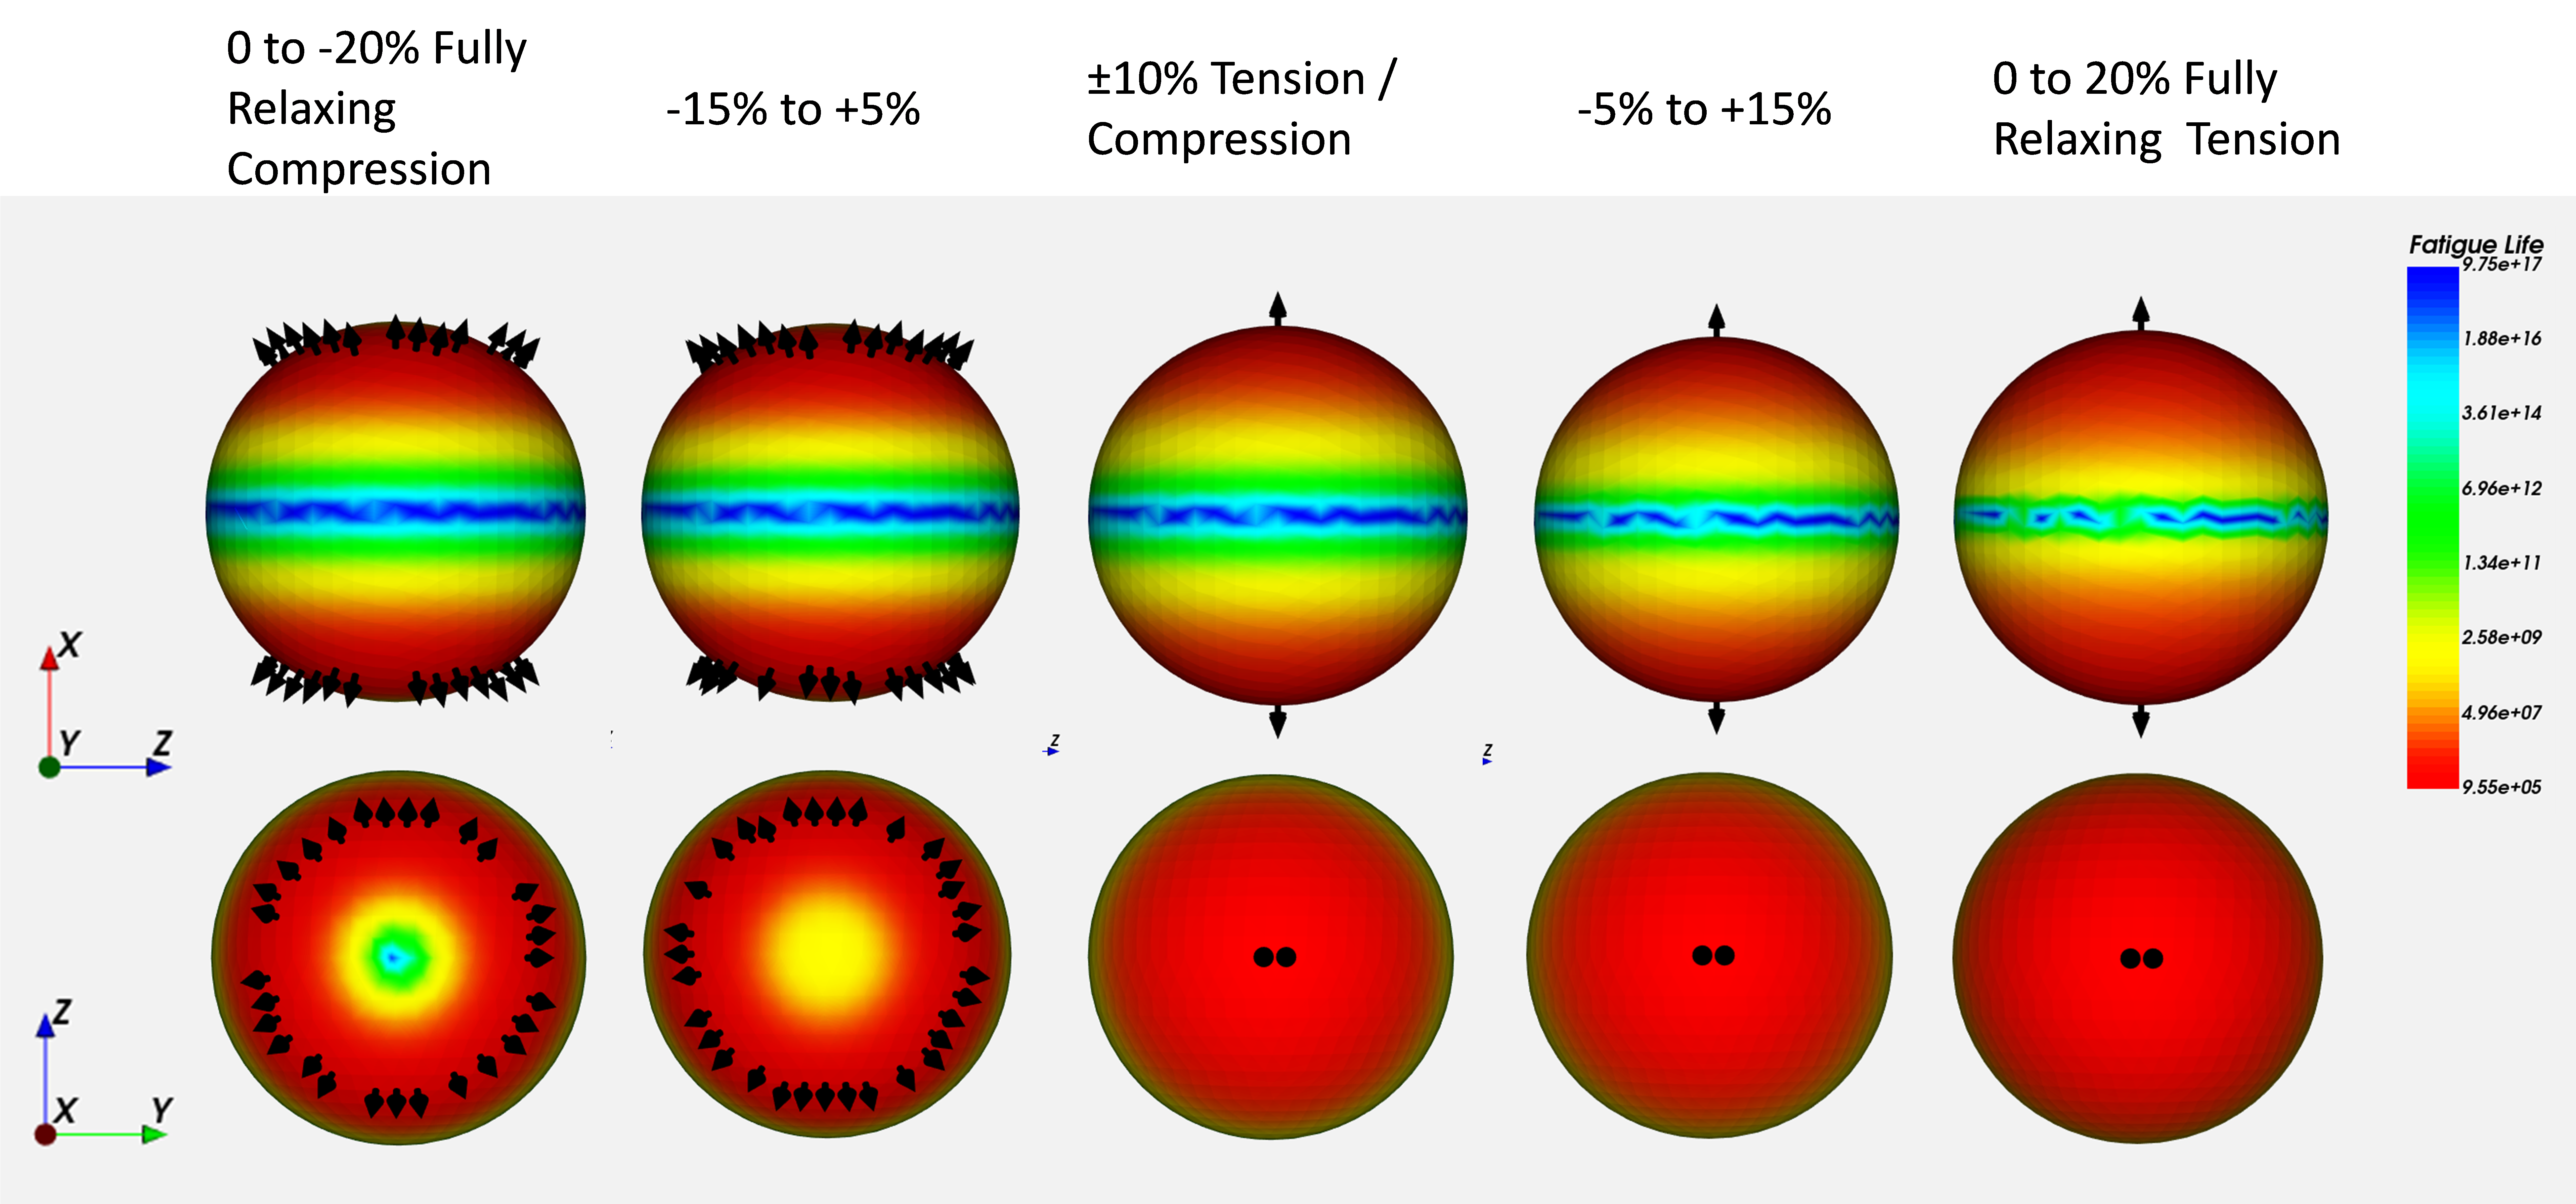
Even for these simple uniaxial cases, the critical plane for simple compression is not the same as the critical plane for simple tension. In simple compression, due to crack closure, the critical plane is the plane that maximizes shearing. These planes make a 45-degree angle with the axis of loading (x direction). In simple tension, however, the critical plane is perpendicular to the load (x direction). In the figure below, the change in the critical plane as the mean strain increases from compression to tension is evident. On each sphere, the arrows indicate the perpendicular of a critical plane.
The next figure shows the cracking energy density (units of mJ/mm3, and proportional to tearing energy) as a function of time on the critical plane for each case. The symbols on each line indicate the times at which the identified crack plane is open or closed. Now we can see clearly that fully reversed tension/compression (ie “R=-1” loading in terms of strain) is really R=0 when viewed in terms of tearing energy on the critical plane.
The computed fatigue life is given in the last figure for each case using this material definition:
MAT=RUBBER
ELASTICITY_TYPE=ARRUDABOYCE
SHEAR_MODULUS=1 ! MPa
LIMIT_STRETCH=4
BULK_MODULUS=3000 ! MPa
FATIGUE_TYPE=THOMAS
FLAWSIZE=0.025 ! mm
FLAWCRIT=1 ! mm
TCRITICAL=10 ! kJ/m^2
RC=3.42E-2 ! mm/cyc
F0=2
X(R)=LINDLEY73
The moral of the story:
- Fully reversed tension/compression cycles (“R=-1” in stress or strain terms) are really fully relaxing cycles (R=0 in tearing energy terms) from the perspective of the crack precursor on the critical plane.
- The critical plane depends on whether you have tension or compression. Wohler curve analysis completely misses the fact that the failure plane is not always perpendicular to the loading direction!
- A simple sinusoidal history that crosses through zero results in separate tension and compression events, each of which has its own peak and valley, and each of which influences the critical plane selection. Wohler curve analysis based on max principal stress or strain amplitude completely misses these physics.