
This workshop spans Monday through Friday, October 19-23, 2026 from 9 a.m. to Noon EDT (UTC-4). Recordings of each day’s sessions are emailed to attendees... Continue reading
This workshop spans Monday through Friday, June 1-5, 2026 from 9 a.m. to Noon EDT (UTC-4). Recordings of each day’s sessions are emailed to attendees... Continue reading
William V. Mars, Ph.D., P.E. is a co-author of the article A Preliminary Conceptual Study for Coupled Thermo-Mechanical and Structural Characterization of Rim-Supported Run-Flat Tires which... Continue reading

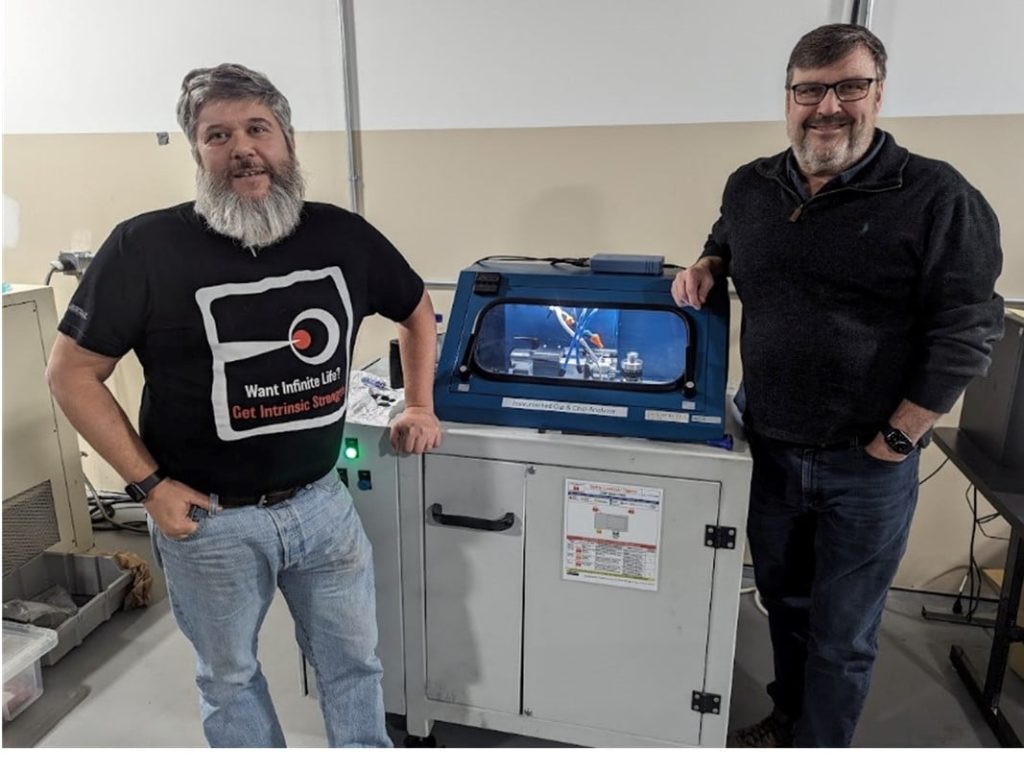
Wow – this year has really been one of many firsts for Endurica. We had our first ever Community Conference in April, we started our... Continue reading
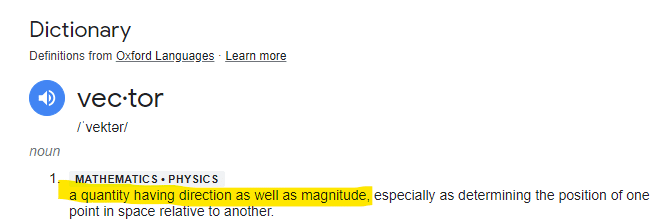
2023 marked year 15 for Endurica. If I had to pick one word to describe the past year, that word would be “vector”. Because magnitude... Continue reading
When there is rolling or sliding contact of a rubber surface over a second hard surface of sufficient roughness, localized cutting and damage of the... Continue reading

I get this question a lot: how well can the Endurica software predict fatigue life? Is it as good as a metal fatigue code, where... Continue reading
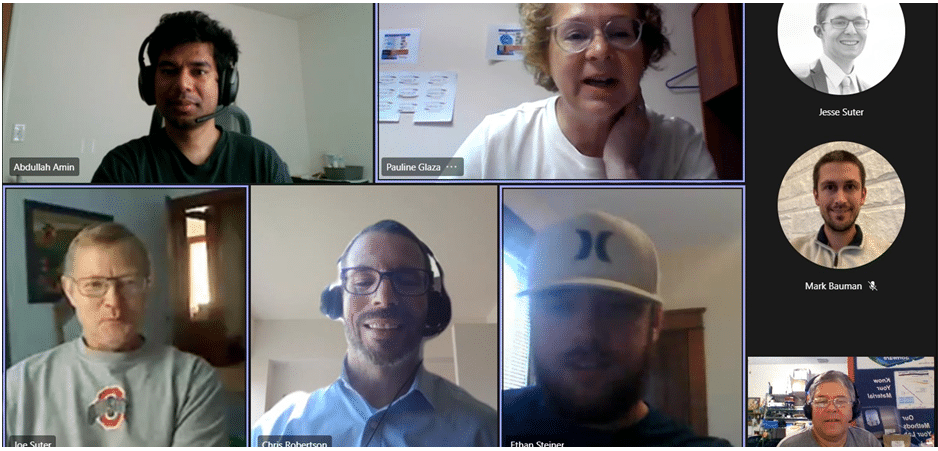
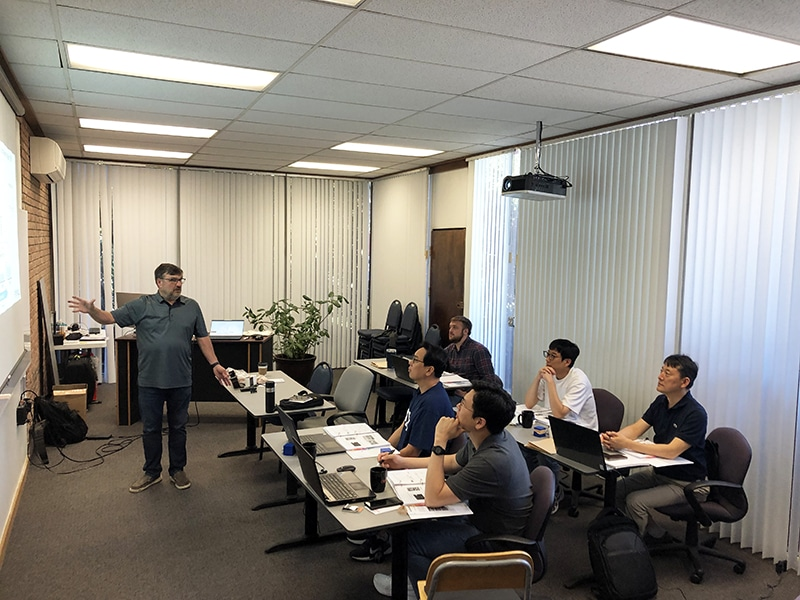
These days everybody’s talking about whether to meet in person or online. There are great tools available for online meetings, and these have helped us... Continue reading
“Is it validated?” – that’s often the first question we hear after introducing our durability simulation capabilities. And for good reason, given the weight that... Continue reading
We have just launched a few updates to our Fatigue Property Mapping service offerings. The changes were: Addition of the all new Reliability Module for... Continue reading
Showing 1–10 of 12 posts