4-in-1

Wow – this year has really been one of many firsts for Endurica.  We had our first ever Community Conference in April, we started our first sister company – in Europe, and from September 9 – 13, 2024, we presented 4 technical papers – a new Endurica record for one week!  The other impressive aspect of this latter feat was that the four presentations were on vastly different topics! I’ll just list the venues and titles and then discuss each one.

International Elastomer Conference 2024, Pittsburgh, PA, USA:

  1. “Heat Build-Up and Thermal Runaway in a Rotating Bending Experiment”

44th Annual Meeting and Conference of The Tire Society, Akron OH, USA:

  1. “Coupled Multiphysics Strategy to Monitor the Health of Rubbery Structures Using Endurica Tools”
  2. “Critical Plane Analysis of Surface-proximal Fields for the Simulation of Mechanochemical Wear”
  3. “Models, Materials and the Move Towards Virtual Product Development”

Let’s start with the first presentation on heat build-up. Will Mars presented this paper at the IEC in Pittsburgh on Tuesday the 10th of September. The presentation highlighted a new machine that has been developed by Coesfeld to evaluate the heat build-up behavior of rubber compounds. It uses a hollow rubber tube that is bent to a 60-90 degree arc and then rotated at about 600 rpm to create a tension-compression cycle throughout the tube due to the pre-bending as shown below.

This test offers many advantages over the historical Goodrich Flexometer self-heating test originally developed in 1937.  The Heat Build-Up Analyzer is instrumented to measure internal temperature as well as forces and deformations while the test is progressing.  The recent advances in the Endurica software and workflows are also equipped to predict the transient behavior in this test.  When the rubber reaches a certain high temperature, the rubber starts to break down, often due to the volatilization of low molecular weight additives creating an exothermic reaction, and also due to the reversion of the cross-links.  The exothermic reaction and thermal “runaway” condition can also be predicted by Endurica software.  The animation below shows the elevated temperatures and the internal pressure rise due to the exothermic reactions. The combination of the HBA test and the Endurica FEA-based analysis will add understanding to the heat-rise behavior of compounds for any company.  As with some other Coesfeld machines, Endurica is the sole distributor in the Americas.

The second presentation listed was presented by Mahmoud Assaad, co-authored by others at Endurica and also by Ed Terrill at ARDL.  This work aims to provide the combination of a full oxygen diffusion and oxidation reaction simulation and experimental characterization capability.   The plot here shows the distribution of reacted oxygen in the crown area of a commercial truck tire.  As the oxygen diffuses into the carcass it also reacts with the rubber compounds creating a phenomenon known as Diffusion Limited Oxidation.  Mahmoud, Ed Terrill and I worked on rubber oxidation with Sandia National Laboratories when the three of us worked together at Goodyear. Now we have developed a characterization and simulation capability that should be ready for customers to try in 2025!

For the third presentation listed, Will Mars quickly travelled from the IEC in Pittsburgh to the Tire Society in Akron to give a talk on an evolving capability for wear prediction. This work was co-authored by Lewis Tunnicliff and James Kollar at Birla Carbon as well as others from Endurica. For many years, researchers have been trying to link rubber fracture and tearing behavior to surface wear. One of the early works on this topic is shown in the drawing below from Southern and Thomas in 1979.

This work attempted to explain observations from blade abrader experiments. The Endurica/Birla work broadens this concept to different asperity shapes and a cumulative fatigue process that depends on the depth into the surface.  Temperature distribution near the surface was also calculated and included in the analysis.  Initial results gave similar trends for wear rates as work done by Gent and Pulford in 1983.  This new approach also makes it easy to also incorporate any aging effects that may occur on the surface of a rubber product. Development work on this new capability will continue well into 2025. In the meantime, Endurica does have a more basic FEA-based offering for wear prediction that has been used for multiple customers.

Lastly, on Friday the 13th of September, I had the honor of giving the Plenary Lecture for the Tire Society conference.  Thanks go to Jim McIntyre and the conference organizers for giving me this unique opportunity to address the society.

In April, we conducted the first ever Endurica Community Conference, and we tied in the Solar Eclipse that passed over Findlay, Ohio on April 8th, to produce a very successful event.  I wanted to include the solar eclipse in my Plenary talk and somehow relate it to topics concerning the development of tires.  The two concepts I used to make the connection were:

  • All models are approximations, but some can be very useful, and
  • Some very good physics theories predict singularities. The singularities reveal our ignorance on the topic and show the area where further work and insights are needed.

The first concept comes from the late George E. P. Box, a statistics professor at the University of Wisconsin. The quote is usually stated as: “All models are wrong, but some are useful”. The second concept makes a tie between fracture mechanics and Einstein’s General Theory of Relativity, which was validated by data taken during a solar eclipse in 1919. Both of these theories predict non-physical singularities but remain extremely useful.

The bulk of my talk was on Virtual Tire Development using tire durability as one of the performances to evaluate without building and testing prototypes. It largely followed my experience and contributions to the topic over the 3+ decades I worked on this at Goodyear with many excellent colleagues and partner organizations like Sandia.

All four of these presentations are available on our website at this location: Fatigue Ninja Frontier – Resources from Endurica’s First Annual Meeting.

Please contact us if you have any questions about these presentations or if you would like to chat with us about anything, including possible work together.

One final note: we are working on a revised website. Our Marketing Director, Pauline Glaza, is heading up a project to develop a new website for us that should make navigating our material and interacting with us much easier.  Expect to see our new site in early 2025!


twitterlinkedinmail

The New Endurica Architecture – It’s Time to Migrate

Our transition to a new software architecture is a vital move in navigating the dynamic technological landscape. In a recent webinar, we discussed the aspects of this transition, providing insights into the why and how of adopting a new architectural approach despite having a functional existing one. This post will highlight the motivations behind the shift, the present status of feature migration, alterations in the latest software release, and an overview of projects within this new framework.

The Rationale and Benefits

Why Overhaul?

The complete rewrite of our software’s architecture was not a decision made lightly. The reasoning extends beyond merely wanting a refresh; it was driven by pivotal motivations, primarily surrounding the necessity for speed and efficiency in executing computing processes. Speed is invariably tied to productivity and operational fluency in software and technology. The plot below illustrates a compelling story: the old architecture (represented by the blue line), exhibited a static runtime, regardless of the number of threads engaged, revealing its inability to utilize parallel processing. Contrastingly, the new architecture demonstrates a significant speed-up, even with just a single thread, and scales to allow an increase in speed by many multiples, contingent on thread capacity.

Solving Larger Problems

The pursuit of faster execution isn’t arbitrary; it is intrinsically linked to our objective of solving larger problems. With larger tasks and projects on the horizon, scaling up and utilizing more CPU threads became essential. Exemplified through a job run on a virtual machine with 96 available CPU threads, the linear decrease in runtime with increasing threads (until certain hardware limitations are met) exhibits the new architecture’s adept handling of larger jobs (see plot below). The capability to scale and manage tasks of escalating complexity and size was a crucial driver for our transition.

Enhancing Integrations and Streamlining Workflows

Then, we turned our attention toward improving the user experience in interfacing with our software. Our prior use of the HFI and HFO file formats, while functional, presented numerous challenges regarding modification and integration, particularly when scripted modifications were necessary. The new architecture employs the JSON file format, widely recognized for its robustness and versatility across various industries and applications. With JSON, modifying job inputs and managing data become significantly simplified, as illustrated by a Python script example, wherein the entirety of job modifications, inputs, and submissions can be seamlessly handled with a handful of lines of code.

Improved Usability and Real-Time Error Checking

In an effort to enhance usability and mitigate the common issue of erroneous entries and syntax use, the new architecture, especially when utilized with a text editor like VS Code, offers real-time checking and syntax suggestions. This not only makes job submission more precise but also substantially reduces the trial-and-error cycle, saving valuable time. Additionally, upon job submission, the new architecture performs rigorous error and syntax checks, ensuring smooth execution and user experience.

Comprehensive Feature Migration: A Successful Transition

Reflecting on the past two years, we have accomplished a near-complete feature migration to the new software architecture, with 99% of features now successfully transitioned. This includes all outlined output requests, material models, history types, and various procedures.
Our commitment to supporting multiple interfaces remains, with support for Abaqus, Ansys, and Marc using the new architecture. Furthermore, Endurica Viewer is fully compatible, providing enhanced visualization capabilities under the new system.
The comprehensive migration and the incorporation of new functionalities marks the new architecture as fully operational and ready for use across all undertakings.

Implementation of Directory and Execution Changes in Endurica Software

Refined Directory Structure

In efforts to provide a seamless transition and user experience with the upgraded Endurica software, modifications have been made to the directory structure. The new architecture, once labeled “Katana” during its development phase, has now been ubiquitously integrated into the top-level Endurica directory. With the most recent software installation, users will observe the top-level CL and DT directories contain the new architecture, and the Katana directory has been removed.

Consequently, when we refer to Endurica CL and Endurica DT moving forward, it denotes reference to the new architecture.

Accommodating Transition: The Legacy Folder

Acknowledging that the transition to the new architecture may not be instantaneous for all users, the old architecture will still be available and designated within a “Legacy” folder. Though it requires navigation into subfolders, we ensure its accessibility for users who need more time to transition fully into the new structure.

Executable Naming Conventions

In tandem with the directory adjustments, executable naming conventions have been revised to be more intuitive. Previously, “endurica” was employed to submit fatigue analyses in the old architecture, while “katana” pertained to the new. To streamline, “katana” has been rebranded as “endurica” for submitting the JSON input file, with the legacy version adopting the name “endurica-legacy.” It is crucial to note that users accustomed to utilizing “katana” may continue to do so — “endurica” and “katana” will run the same executable. However, usage of the old architecture requires invoking a new “endurica-legacy” command.

Delivering the Unattainable with Endurica’s New Software Architecture

Embarking upon two recent projects with our new computational architecture, we explored the realms of virtual simulation and data management in tire durability and elastomeric mount durability performance.

Project 1: Tire Durability with Dassault Systems

In collaboration with Dassault Systems, a multi-body dynamic simulation was conducted to compute tire durability at the Nurburgring circuit. Utilizing SIMPACK for generating virtual road load data and employing Endurica EIE and Abaqus to establish a workspace map of driving conditions, the endeavor yielded significant data, processed through 176,000 time steps to evaluate the tire’s fatigue life. After a meticulous analysis, the results spotlighted the fatigue life to be 214 laps, pinpointing the most critical point around the tire bead edge.

Project 2: Durability of an Elastomeric Mount with Ford

Undertaken with Ford, the second project navigated through the durability performance of an elastomeric mount, involving a behemoth of data from 144 load history files, each load file containing tens or hundreds of thousands of time points, accumulating to over 15 million total time points. Utilizing a similar approach as the Nurburgring project, Endurica EIE and Abaqus were used together to generate the strain history data. The analysis focused on membrane elements on the mount’s free surfaces to precisely gauge surface strains. Culminating the analysis, the project succeeded in qualifying the part with a fatigue life of 9.4 repeats of the entire schedule, wherein the requisite was just one repeat.

These projects underscored the capabilities of our new architecture, navigating through large data sets and providing tangible insights in significantly reduced timeframes compared to the old architecture. In essence, the implementation of the new architecture has not only streamlined our processes but also expanded our horizons in handling large data and achieving nuanced analyses in our projects.

Summary

The new Endurica CL and Endurica DT architectures have now fully replaced our old system, maintaining the accuracy our users expect while introducing an easier, more powerful, and scalable solution. Everything has been successfully migrated over to this complete solution. With its enhanced capabilities, it addresses problems that were previously too large or took too long to solve, enabling our customers to tackle challenges they might not have considered before. The ability to solve unprecedented problems is just one more example of our steadfast commitment to providing accurate, complete, and scalable solutions.

twitterlinkedinmail

License Queueing

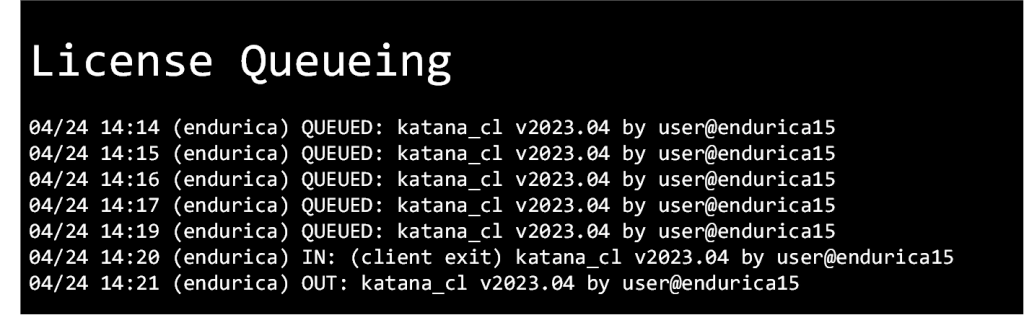
Design optimization studies are driving a need to support the efficient management and execution of many jobs.  This is why we are announcing that Endurica’s software license manager now supports queueing for licenses. This allows a submitted job to automatically wait to start until enough licenses are available, instead of the prior behavior of exiting with a license error. Now you can submit many jobs without worrying about license availability.

License queueing is only available for network licenses (not node-locked). It is currently supported for Katana CL/DT jobs and EIE jobs submitted from a command prompt.

To enable queueing, set the environment variable RLM_QUEUE to any value. This environment variable must be set on the client machine (not the license server).

To learn more about license queueing, search for “How to Queue for Licenses” in the RLM License Administration documentation here: https://www.reprisesoftware.com/RLM_License_Administration.pdf


twitterlinkedinmail

Road Loads to Block Cycle Schedule

 Road loads being converted into block cycle schedules through Endurica softwareRoad load signals are notoriously difficult to work with. The signals feature so many different time increments that it becomes too much to directly model efficiently in FEA. It is difficult to tell which portions of the loading do the most damage. Experimental fatigue testing would be too time-consuming and costly to run on the full complex road load signal. For these reasons simplifying road loads into block cycle schedules has become the gold standard for working with road load signals. Experimental testing and FEA modeling are more manageable when using a block cycle schedule instead of the full road load signal. Traditional methods of converting a road load signal to block cycle schedule can often fall short. Endurica recently added a built-in method in the Endurica CL software that uses the power of critical plane analysis and rain-flow counting to automate block cycle creation.

Let us dive into the process of block cycle creation using an example of a bushing and a road load history. The road loading history shown below contains results for loadings in 3 axes over a time history.

 Road Load Time History Graph

The first step in creating the block cycle schedule is solving for the strain history over the entire road load history. Fortunately, Endurica EIE comes to the rescue in solving for the long strain history. The road load time history does not need to be modeled directly in FEA. Instead, a map is run in FEA to solve for strain history within the bounds of the road loading. Endurica EIE quickly interpolates the strains from this map to create the full loading strain history. In the animation below the map points solved for in FEA are shown as black dots and the bushing traces out the path of the map.

Endurica EIE quickly interpolating the strains from this map to create the full loading strain history

After the full road load strain history has been solved for in EIE the fatigue life for the road load signal is ready to be analyzed in CL. The fatigue analysis of the entire road load signal gives valuable insight into finding the critical location, developing the block cycle, and allowing the fatigue life of the block schedule to be validated against the fatigue life of the road load. The critical location of the bushing is shown in the image below:

The fatigue analysis of the entire load signal shows the critical location along with an estimated fatigue life

At the bushing critical location, all damaging events on the critical plane are taken into account when creating the block cycle schedule. The events are grouped into different bins categorized by two parameters: the peak CED and R ratio. The analyst remains in control by selecting the number of bins to group into. Each of the bins contains events with similar peak CED and R ratio that falls within the bounds of the bin. Within each bin, a representative cycle is identified that when repeated in the block schedule will contribute at least as much damage as all the various events in the bin. This selection process produces a conservative result that ensures that the block cycle will be at least as damaging as the road load.

 Grouping Damaging events into Bins

The bin results from the original history show the number of times each bin is repeated and the total damage from each bin. At this point, the bins that contribute insignificant damage can be safely eliminated from the block cycle schedule to save testing time and complexity without changing the results.

Comparison of Original history to Block Schedule


The simplified block schedule is then modeled to check the fatigue life vs the full road load signal. The results show that the critical location and fatigue life has been accurately maintained in the block schedule.

 Road Load vs. Block Cycle Fatigue + Damage Spheres

This automated block cycle creation procedure succeeded in producing a block cycle with the same critical location and very similar fatigue life. The block cycle selection was able to re-create the full road load signal using only three different loading blocks.

Endurica CL automated block cycle creation lets you take the guesswork out of block cycle creation and harness the proven power of Endurica fatigue analysis technology to get durability right.

twitterlinkedinmail

Things that went right in 2020 at Endurica

Things that went right in 2020 at Endurica

2020 is burned in all our minds as a chaotic and tough year.  Just like the rest of the world, Endurica staff experienced times of isolation and loss due to the pandemic.  On a positive note, we invested heavily in making our tools and workflows better than ever so that we’re ready to come back strong in 2021.  Here is a list of our top new developments in 2020:

Endurica Software Enhancements

  • Endurica DT’s new Ageing Feature now enables you to simulate how ageing affects your rubber product. Your compound’s stiffness, strength, and fatigue properties can all evolve with time.
  • Our new Linux distribution takes our solutions beyond the Windows world.
  • We’ve added an encryption feature to safeguard your trade secrets.
  • Viewer Improvements make it easier than ever to visualize your fatigue simulation results.
  • EIE Enhancements give you blazing-fast compute speed for full road-load signals.
  • We’ve also planned an aggressive development agenda for 2021. Stay tuned for a new Endurica-based smartphone app for materials engineers, for a new feature that computes fatigue threshold safety margins, for a new block cycle schedule extraction algorithm, and more!

Training

  • The new Fatigue Ninja Friday webinar series provides step-by-step application training for key the workflows that you need to get durability right. All of the recorded episodes are now available in the online Endurica academy.
  • The new Winning on Durability webinar series provides high-level overviews of both technical and business topics so you can connect Endurica tools to your strategic imperatives. All of these recorded webinars are available gratis on our website.
  • We’ve recast our in-person training events as LIVE, ONLINE workshops accessible safely around the world.

Testing Instruments

Fatigue Property Mapping Testing Service

  • We added the Reliability Module to our Fatigue Property Mapping testing service. Use it to quantify crack precursor size statistics when you need to estimate probability of failure.
  • We also reorganized the Thermal Module and the Ageing Module into Basic and Advanced levels, to offer a lower price-point when a basic option will suffice.

Want to leverage any of these new capabilities in your next durability project?  Give us a call and let’s talk!

twitterlinkedinmail

Endurica 2019 Updates Released

Endurica CL

Endurica CL received many improvements over the past year.  These improvements cover a wide variety of different aspects of the software:

Reducing Run-time

Our investments in code benchmarking and performance are paying off! We’ve been able to make internal optimizations to the code that reduce analysis run-times by approximately 30%. 

HFM and HFO Formatting

To make our output cleaner and more meaningful, small changes have been made to the number formatting in the HFM and HFO files.

All results reported in scientific notation are now formatted in standard form where the leading digit before the decimal point is non-zero (previously the leading digit was always zero).  This gives one more significant figure to all the results without increasing the output file size.

Signal compression

The shortest fatigue life for the analysis is now printed to the console and HFM file with six significant figures.  Previously, the life was reported with only two significant figures.  This change makes it easier to quickly compare two different analyses, especially when the analyses have similar fatigue lives.

New features have been added to Endurica CL to make it easier to process and analyze histories.  Using the new COMPRESS_HISTORY output request, you can generate new HFI files containing compressed versions of your original history.  The generated history is composed of the rainflow counted cycles from your original history.  An optional output parameter allows you to further compress the signal by specifying the minimum percentage of the original damage that should be retained in the new history.  When keeping a percentage of the damage, the cycles are sorted from most to least damaging so that the generated history always contains the most damaging cycles and discards the least damaging cycles.

This output request is useful when you want to reduce a long complex history while keeping the important damaging cycles.  This can reduce file sizes and simplify experimental testing setups as well as give you a deeper insight into your duty cycle. 

Endurica DT

Endurica DT is our incremental fatigue solver.  With Endurica CL, your analysis starts at time zero and integrates the given strain history until end-of-life.  With Endurica DT, you can start and end at a series of times that you specify.  This lets you accumulate many different histories and loading conditions repeatedly until end-of-life.

With Endurica DT, it allows you to start and end at a series of times, when specified.

Endurica DT gives you new ways to control your analyses, and we have been using it over the past year in many applications.  For example, fatigue results for laboratory test procedures that involve multiple loading stages (such as FMVSS No. 139 for light vehicle tires, or block cycle schedules for automotive component applications) can be fully simulated using Endurica DT. You can also compute residual life following some scheduled set of load cases. 

Endurica DT can also be used to accumulate the actual loads measured on a part in situ.  This allows you to create a digital twin that keeps a near real-time record of the part’s current simulated damage state and the part’s remaining fatigue life. 

Stiffness Loss Co-Simulation

Endurica DT now includes a stiffness loss co-simulation workflow that allows you to iteratively update the stiffness of your part over a series of time steps, based on the amount of damage occurring in the part.  The stiffness loss is computed per element so you will have a gradient where the more damaged regions become softer.  Endurica DT computes the current fraction h of stiffness loss based on the stress and strain, and the finite element solver computes the stress and strain based on the current fractions of stiffness loss. The capability accurately predicts the effects of changing mode of control during a fatigue test.  For example, stress controlled fatigue tests show shorter life than strain controlled fatigue tests. 

Endurica DT now includes a stiffness loss co-simulation workflow

Endurica EIE

Endurica EIE, our efficient interpolation engine, quickly generates long, complex histories using a set of precomputed finite element results (i.e. the ‘nonlinear map’).  We first launched EIE last year with the ability to interpolate 1-channel and 2-channel problems.  We have recently added the ability to interpolate 3-channel problems. 

In the example below, EIE was benchmarked with three-channels.  Three separate road load signals were computed from a single nonlinear map.  With EIE, you don’t need to rerun the finite element model for each history.  Instead, EIE interpolates from the nonlinear map, providing the equivalent results with a 60x speed-up in compute time. 

Endurica EIE interpolates from the nonlinear map, providing the equivalent results
twitterlinkedinmail

Our website uses cookies. By agreeing, you accept the use of cookies in accordance with our cookie policy.  Continued use of our website automatically accepts our terms. Privacy Center