
Hello everyone. I am really excited to be writing this as the newest member to Team Endurica! I am really enjoying my on-boarding with Will... Continue reading
Return to previous page
Page 3
Expanded our team! We welcomed 35-year Goodyear veteran Tom Ebbott to our team as Vice President, and at one point we had 3 interns working... Continue reading
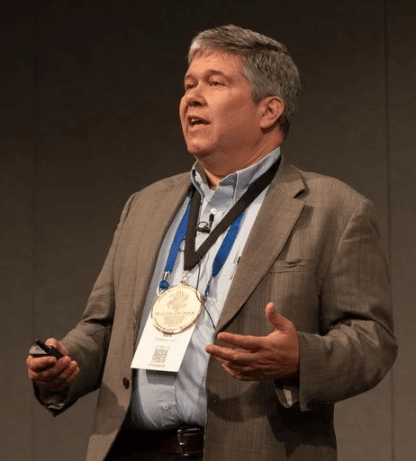
William V. Mars, Ph.D., P.E. 2022 Harold Herzlich Award Winner Acceptance Speech at ITEC 2022, Akron, Ohio on 15 September 2022 Three key takeaways from... Continue reading

2 Minute Read | 400 Words I ran a marketing consulting business for 30 years before joining Endurica and tried to save clients from learning... Continue reading
In fatigue testing, R is the ratio of the minimum to the maximum occurring during one period of a cycle. If the mean value... Continue reading
True or False? Test your knowledge about Endurica Endurica is only a software company. False. While Endurica is perhaps best known for its game-changing... Continue reading
There were several papers on fatigue life prediction for elastomers at SAE WCX 2022, but the highlight for us was this one from Automotive... Continue reading
How do you respond to the call for sustainable solutions in the rubber industry? Is it via bio-sourced polymers or fillers? elimination of carcinogenic additives... Continue reading

Once a year, we ask our users to weigh in on what we can do to further improve your experiences with the Endurica fatigue solvers. ... Continue reading
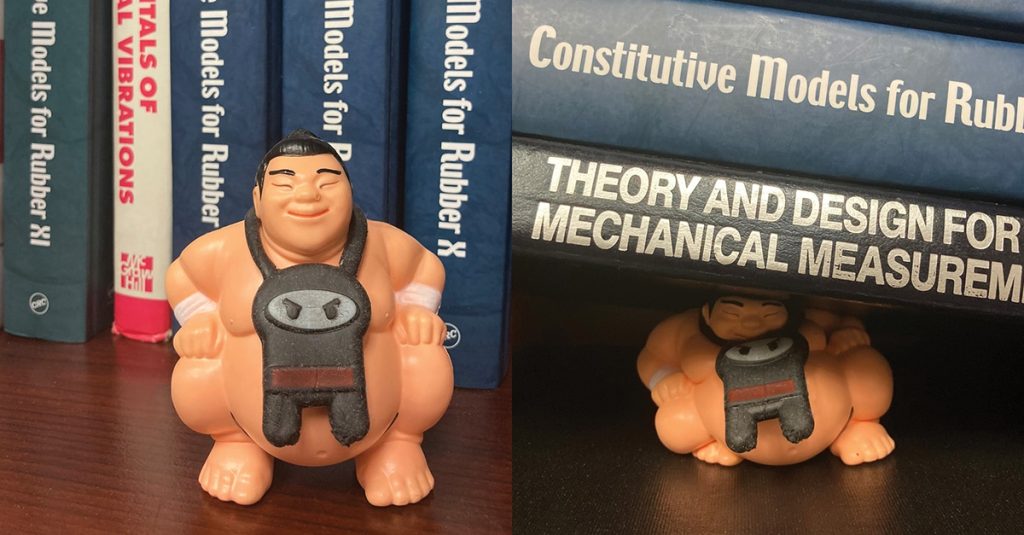
Rubber can be formulated in a very wide range of properties. For materials developers, this cuts two ways. On one hand, it means that... Continue reading
Showing 21–30 of 56 posts