

The Tire Society held its 40th annual meeting last month with the theme The Virtual Tire. It has always been the place to see up... Continue reading
Return to previous page
Page 4
These days everybody’s talking about whether to meet in person or online. There are great tools available for online meetings, and these have helped us... Continue reading
We’ve just added a new output to the Endurica fatigue solver: Safety Factor. This feature makes it simple to focus your analysis on whether cracks... Continue reading

So, you’ve got a tricky durability problem to solve, a budget, and a deadline. Let’s look at a helpful framework for sorting which Endurica workflows... Continue reading

2020 is burned in all our minds as a chaotic and tough year. Just like the rest of the world, Endurica staff experienced times of... Continue reading
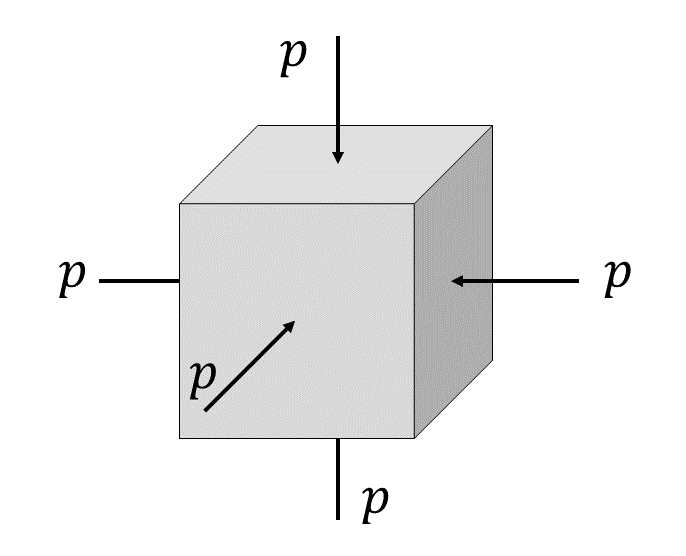
A question was recently put to us regarding the effects of cyclic hydrostatic loading on rubber. In hydrostatic loading, no shearing stresses are present, and... Continue reading

“Is it validated?” – that’s often the first question we hear after introducing our durability simulation capabilities. And for good reason, given the weight that... Continue reading

The old saying “loose lips sink ships” is as true in product development as it is in war. Maybe more so – while warships are... Continue reading

It has been 20 years since Critical Plane Analysis for rubber was first conceived and validated. There were early signs of its significance. It won... Continue reading
We have just launched a few updates to our Fatigue Property Mapping service offerings. The changes were: Addition of the all new Reliability Module for... Continue reading
Showing 31–40 of 56 posts