Taming the Tarmac: Simulating Tire Durability on the Nürburgring
It was May of 2023, and Will Mars had just given a presentation on “Virtual Qualification of the Durability Performance of an Elastomeric Mount with Endurica” at the Simulia SAUC in Novi, Michigan. This work was done with Ford and it used Endurica EIE to efficiently analyze the durability of an engine mount using data from 144 track events totaling over 15 million time steps with 3 channels of input. This was the largest EIE analysis done to date, and showed how a part could be qualified virtually by utilizing the actual track qualification data together with Endurica DT and EIE.
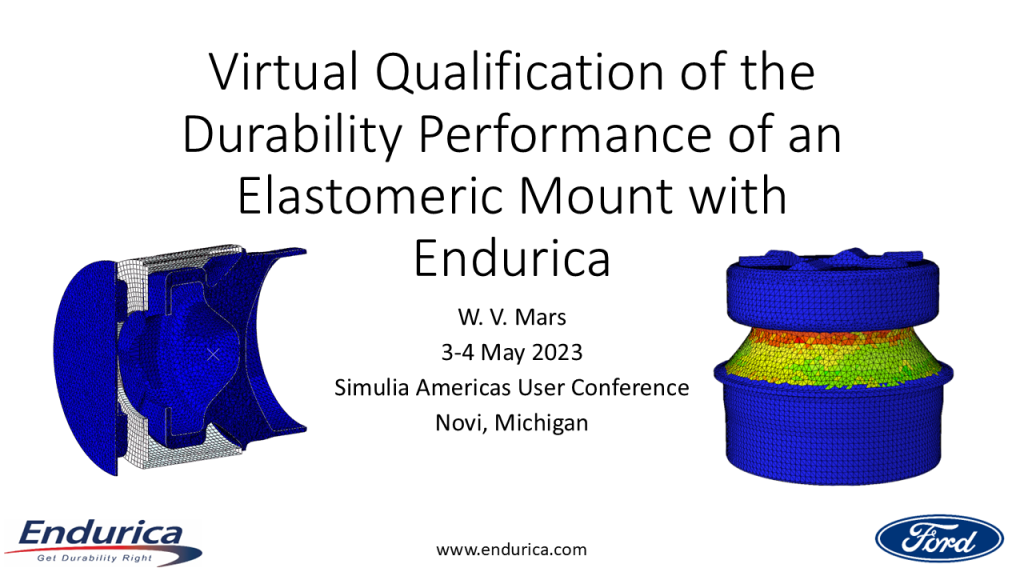
Figure 1
After the presentation, John Lewis of Simulia approached the Endurica team with an idea. What if we simulated another track event, but instead of test data, we generate the data virtually from a vehicle dynamics model? That would provide a totally virtual path for durability prediction without the need for physical data from events on an evaluation track.
The primary team consisted of John Lewis, Expert Technical Sales Solution Consultant at Dassault Systemes and Jason Barr, Simulia Industry Process Consultant together with Will Mars, Jesse Suter and Ethan Steiner from Endurica. The team chose to simulate the famous Nürburgring circuit in Germany for the demonstration, and to show how to predict tire durability and fatigue life on the track. They also planned to present the work at the Tire Society conference in September – just 4 months away!
The workflow for the simulation is shown below in Figure 2. The summary of the steps in the workflow are as follows:
- Obtain a model of the Nürburgring track
- Assemble a MBD model of a car in Sim Pack
- “Drive” the car around the track and record the time history of target tire quantities
- Define the range of the target quantities to use in the tire FEA
- Perform multiple nonlinear tire FEA runs to provide solutions for stress and strain spanning the space of the target tire quantities. Endurica EIE organizes the analyses and results.
- Define an interpolation map between the various FEA runs to be able to predict the stress and strain state at any element for the loads in any time step.
- Run the time-history of loads through the map and define the stress and strain state at each time step
- Use the calculated stresses and strains together with the hyperelastic and fatigue properties to calculate the increment of damage (crack growth) due to each time step. Sum up the increments of crack growth until a level of damage is reached that is deemed to cause failure of the structure.
- Equate the number of repeats through the one-lap time series to the number of laps that the most critical tire (chosen as the left front) can endure on the track.
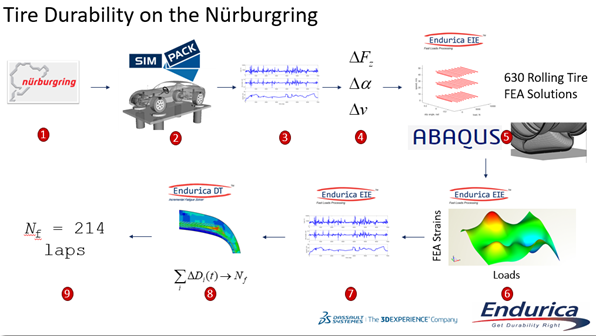
Figure 2
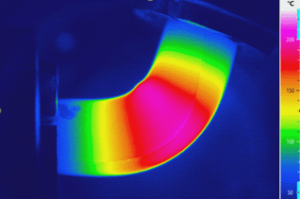
The first task was to generate the time series of loads on the tires as the track is traversed. The Simulia team engaged two of their colleagues, Anand Pathak and Salil Harlikar to perform the multi-body, vehicle dynamics simulation. They used a model of the Nürburgring track and the Simulia “Blue Car” together with a TMEasy tire model calibrated with FEA solutions for the tire – see Figure 3 – and
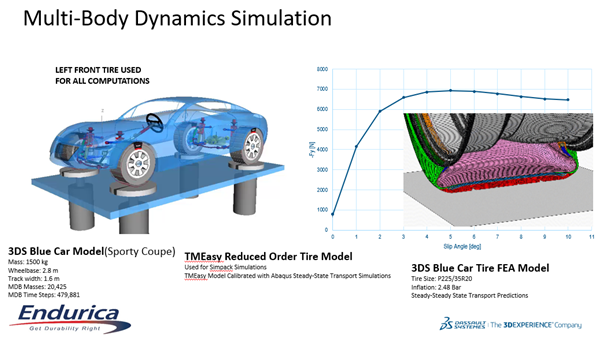
Figure 3
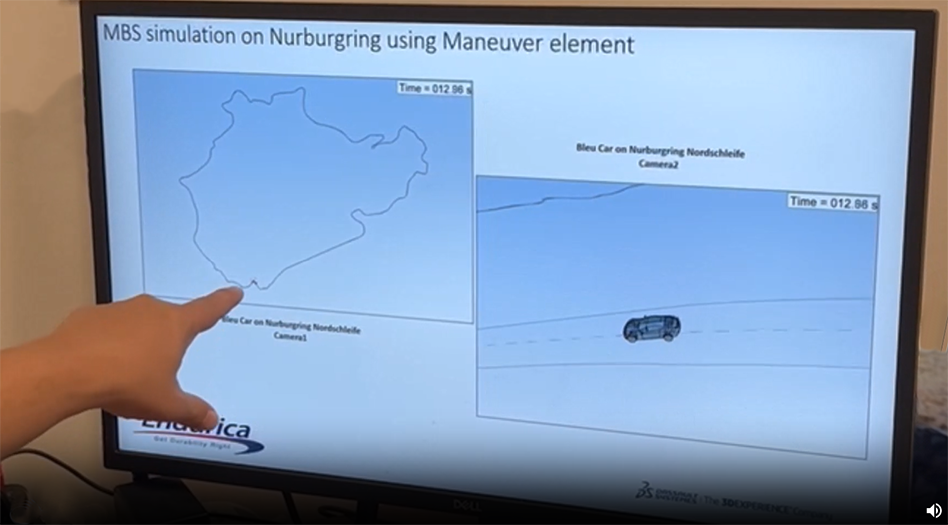
the SimPack Driver Maneuver Element to drive around the track (Figure 4). The resulting time histories are shown in Figure 5. The time histories of interest are the normal load, the slip angle and the speed. As it turns out, that driver element is not as aggressive as a typical human driver on this track. One example, the speed is not as high as an actual driver would achieve. For reference, 40 m/s is about 144 km/hr. Also, the lap time for the driver element is 11 min and 40 sec, compared to typical fast laps of between 6 and 8 minutes. Nonetheless, this time-history is more than sufficient for the demonstration at hand. It’s just not bragging-rights-worthy for Nurburgring where the current top recorded speed of 6:29.090 is attributed to a Mercedes AMG One driven by Maro Engel on September 23, 2024.
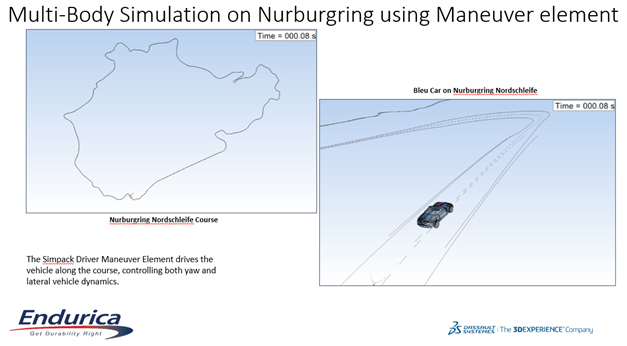
Figure 4
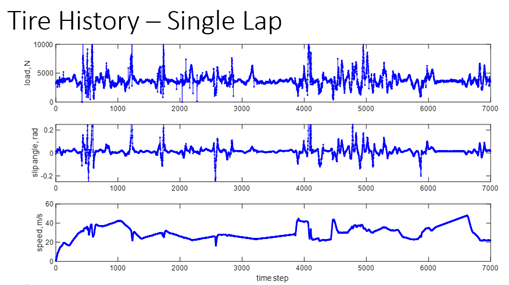
Figure 5
The ranges of the normal load, slip angle and speed, ΔFz, Δα, Δν, are used to define the outer limits of the boundary conditions for FEA runs used to span the loading space. Jason Barr chose a regular array of analyses to span the space as shown in Figure 6 using 3 speeds, 8 normal loads and an average of 21 slip angles. Other options for spanning the space are available with Endurica EIE. Figure 6 also illustrates how Endurica EIE helps to build the map and connect all the FEA results.
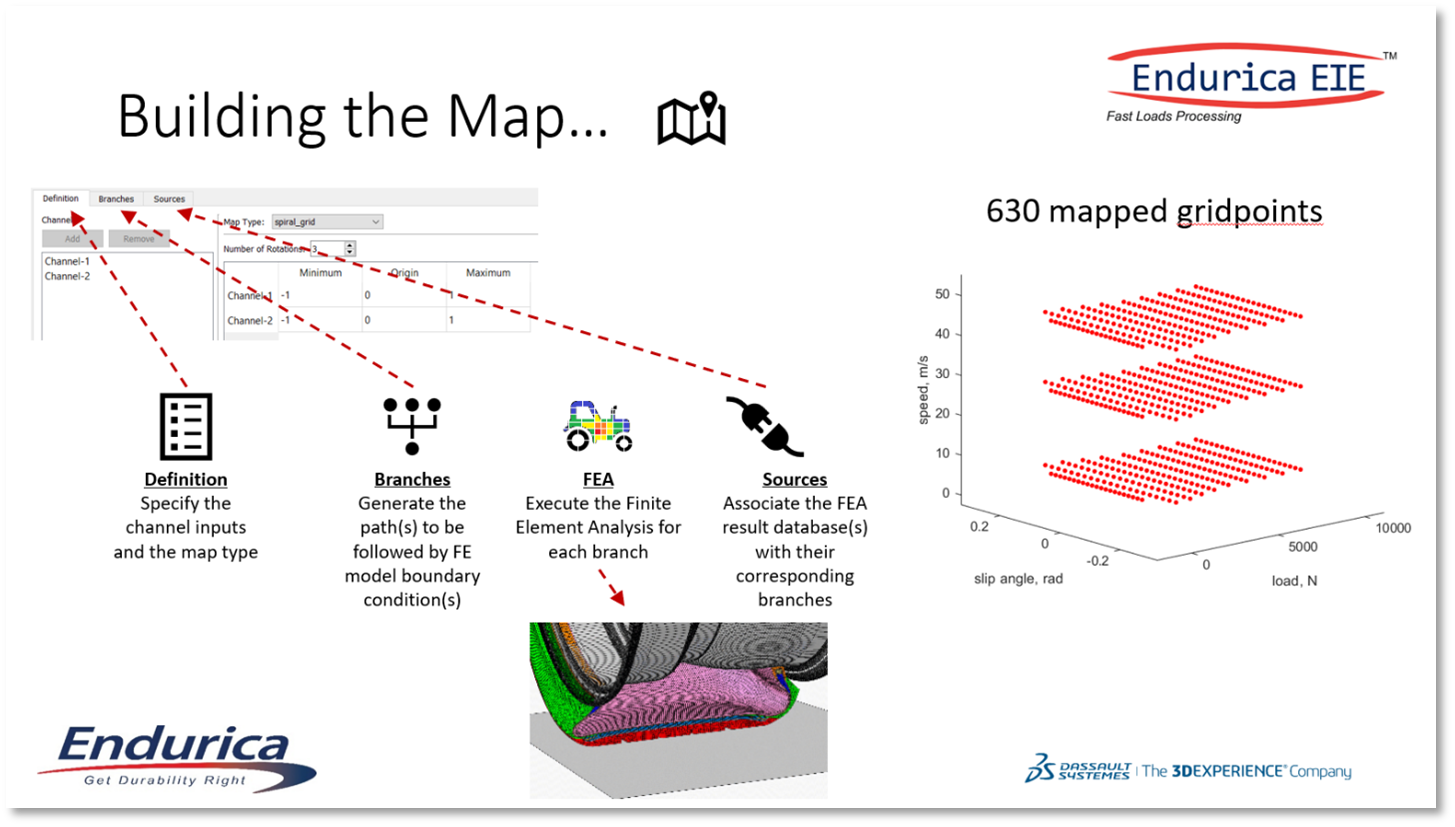
Figure 6
Once the map relating the input Fz, α, ν for each time step to the stresses and strains in each element is created, then the time series in Figure 5 can be played through the map, which acts like a big look-up table, and the stresses and strains are produced for each time step. Now, there is one more step that is needed for tires and wheels, that is not required for most other components. Since the tire is rotating, it produces its own time history for a material element due to the rotation through the footprint. This is accounted for by superimposing another 25 time steps on top of each of the vehicle time steps to account for the strain cycle around the circumference of the tire. This approach is illustrated in Figure 7.
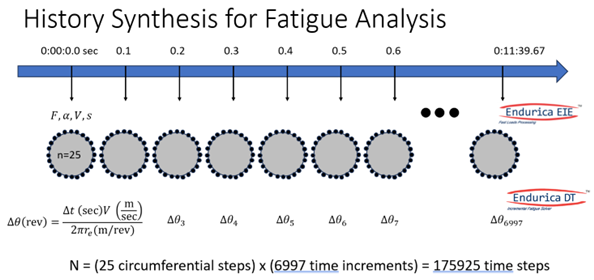
Figure 7
So, the force, slip angle and speed histories are transformed into six components of stress and strain history for each element in the tire. These histories are then rainflow counted and for each rainflow cycle an increment of damage is calculated and summed to the previous total damage using Endurica DT. This process proceeds with multiple laps until the amount of damage is deemed sufficient to cause structural failure; in this case a 1mm crack at the most critical region which was the tire belt edge. The result of the calculation shown in Figure 8 is that the left front tire, assumed to be the most critical for a clockwise track, was able to endure 216 laps.
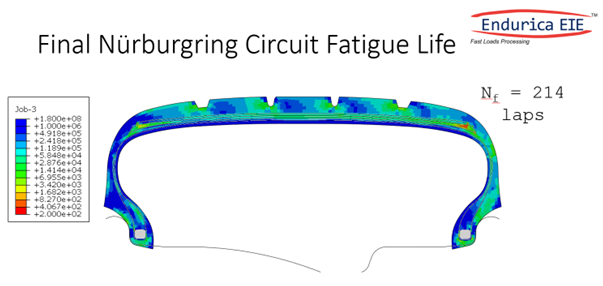
Figure 8
So, there it is. An entirely virtual approach to tire durability prediction on a given track or road course. Here are a couple of thoughts for future work.
First, this analysis was performed with a constant temperature for the entire tire and entire track history. Tires actually have a temperature distribution throughout the cross section and they will also have transient temperature rise in the corners. High temperatures will impact fatigue properties and also potentially contribute to evolution of the rubber compound’ chemistry. A coupled transient thermo-mechanical analysis is being investigated as a next step.
Secondly, the laps-to-failure of 216 seems a bit long when talking to experts. Recall that the Simpack Driver Element was not as aggressive as many of the actual drivers would be. So, another improvement would be to utilize a more aggressive driver element, or an actual driver in the loop. Data could be taken from an actual vehicle on the track, but that would take away from the “entirely virtual” goal of the analysis. Another possibility would be to use a vehicle driving simulator with a human driver in the cockpit, drive around the track, and produce the required time histories for the analysis. This possibility is shown in Figure 9. The only different from the approach in Figure 2 is the initial step where here the time histories are generated with a driver in a simulator driving around the Nürburgring track.
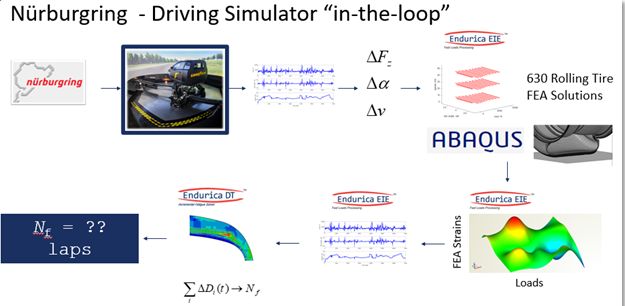
Figure 9
This approach has been presented many times by both Endurica and Simulia and has generated a great deal of interest. We are looking forward to the next steps to make this an even more valuable tool as part of tire and vehicle development.